Enhance your Investments & Trading Strategies with our Indicators
Optimize your Entry Points. Extend your Take Profits. Reduce your Stop Loss.
Discover the competitive advantage you need! With our exclusive indicators, you will be able to accurately detect deficiencies and manipulations in Forex, Stocks and Crypto Market. Make strategic decisions that maximize your profits and minimize your risks. Don't miss this opportunity and take your operations to the next level!
- Liquidation Heatmap : Bitcoin, Altcoins, Gold, Forex, ETF and Stocks
- Liquidation Simple Map
- Liquidation Profile
- High Frequency Chart
- TrenDiff: Trend indicator
- Historical Chart
- BTC Supplier Model
- Crypto Emission Rate Free
- Bitcoin vs Gold Free
- BTC & ETH CME Futures Free
- ETF & Companies: Bitcoin Holders Free
- Risk Calculator Free
- On Fire Heatmap & HF Free
- Liquidation Heatmap on Hyperliquid DEX Free


Discover the competitive advantage you need! With our exclusive indicators, you will be able to accurately detect deficiencies and manipulations in the crypto market. Make strategic decisions that maximize your profits and minimize your risks. Don't miss this opportunity and take your operations to the next level!
- Liquidation Heatmap : Bitcoin, Altcoins, Gold, Forex, ETF and Stocks
- Liquidation Simple Map
- Liquidation Profile
- High Frequency Chart
- TrenDiff: Trend indicator
- Historical Chart
- BTC Supplier Model: Total mining cost of 1 BTC
- Crypto Emission Rate Free
- Bitcoin vs Gold Free
- Bitcoin & Ethereum CME Futures Free
- ETF & Companies: Bitcoin Holders Free
- Risk Calculator Free
- On Fire Heatmap & HF Free
- Liquidation Heatmap on Hyperliquid DEX Free


Price doesn't move randomly
It moves to liquidate traders
Anticipate zones where the market will seek liquidity. Our Liquidation Map shows you exactly where leveraged positions accumulate.
It's the tool institutional traders use to anticipate market movements.
Access the Liquidation Heatmap nowReal advantages for your trading
Avoid being liquidated
Identify high liquidity zones before opening positions. Place strategic stops away from zones where price will go to "hunt" liquidations.
Avoid getting trapped in bad entries
Detect market traps before falling into them. Visualize where price may bounce after liquidating massive positions.
Improve your entry precision
Enter the market in zones with high reversal probability. Use liquidations as confirmation of your technical analysis.
Take profits at the right moment
Identify levels where price may stall. Close positions before the market reverses in high liquidity zones.
Real advantages for your investments
Understand market cycles
Stop investing by emotion. Understand the different stages of the price cycle and act with patience, judgment, and conviction.
Detect optimal Bitcoin buying zones
Investing large capital at bad levels costs years. Identify zones where the market creates accumulation opportunities with better risk/reward ratio.
Build a more robust portfolio
Analyze each asset from its monetary structure and market conditions. Diversify with fundamentals and reduce unnecessary risks.
It's not just another indicator
It's the market X-ray that shows you where leveraged money is and where price will go to hunt it.
Start trading with an edge nowTestimonials
What people say about us on X
Real experiences from our community shared on X


Classic liquidity sweep. Running the stops on the shorts in low liquidity early morning trade and now sending us lower liquidate longs. Hold on.

Special thanks to @IvanPazChain the CEO from @tradingdiff for attending today's weekly stream We discussed its platform & inparticular there bespoke "Strength Indicator" that had flash -3 this morning Thanks to those that attended the stream & took advantage of this $BTC set up


📊 Liquidity Play in Progress 📉➡️📈 We’re currently sitting at 109k, but don’t be surprised if we sweep liquidity at 98k before making a real move to 117k+. This is how the market moves — take the low-hanging fruit (stop-losses, late longs), reload in deep demand, then launch.


Tenemos limpieza en zona de máximos de la estructura. 👀 Si consolida el reingreso se activarían setups bajistas que tendrían como objetivo limpiar la zona de liquidaciones de longs que hemos comentado los últimos días. A ver si se da el escenario! 🔥 https://t.co/IsqzGvLCOT

So cool! I like the gold liquidations, please keep adding further markets 💪


Novo vídeo no canal! 🚨 BITCOIN em ZONA de PERIGO!!https://t.co/aepjWzgXYp


@tradingdiff Gracias Amigos. Sus Herramientas y Nos Ayudan Mucho . Que Siga Creciendo El Canal.. Abrazos

Is $ADA heading back for the .24 cent level? As $Bitcoin buying fades alts will bleed deeper. @tradingdiff liquidity zones are actual cheat codes! https://t.co/EAvePHvU02


Vamos a probarlo... una herramienta que puede complementar el resto de análisis que hacemos a diario.


I've been talking so much about @tradingdiff and how it helps me get ahead of the curve with the High-frequency trading bots indicator and liquidity pools. Also have a YouTube video for our Romanian community here: https://t.co/mtjV9S2jgN


I hope this THREAD has helped you understand what “Liquidity” means. For this information and trading bots, I personally use @tradingdiff Optimize your trading. Learn about liquidity.


Coisa boa sempre deve ser compartilhada,uma das melhores plataformas do mercado. https://t.co/rcvD38CnD2


🛑LIQUIDEZ EN #BITCOIN Y OTRAS CRIPTOMONEDAS #HEATMAP @tradingdiff #ETH #XRP #TRX #LINK #DOGE HOY CON @IvanPazChain https://t.co/PB7EbRqcYO

@tradingdiff Great insights on TRX liquidity zones! Charts like these remind us how important it is to monitor market dynamics. Building a launchpad means staying on top of these trends to provide better opportunities.

Una herramienta IMPRESCINDIBLE en crypto que la gente debería tener si invierte sin duda (hagas trading o no) Es @tradingdiff la mejor a nivel: -Mapas de liquidaciones futuros Crypto (Forex y stocks tmbn) -Trackeo de ETFs -Indicadores únicos tendencias trading Os cuento⏬ https://t.co/Z52V8HpiiP


Tremendo el Liquidation Heatmap en #Stocks Nvidia #NVDA respetando a la perfección las liquidaciones. Fue por todos los shorters, liquidó y ahora rebotando al rango. 👏👏👏 Excelente trabajo @tradingdiff #trading #forex https://t.co/qOUC1VQg6s

Furthering this, if we look at $XRP short term liquidity (as courtesy of @tradingdiff); And we zoom out a little further; https://t.co/xojYna3Ktl https://t.co/P8wCRumzcc


Con el holderpack es suficiente si buscas algún ingreso extra y solo hacer inversiones a largo plazo


Resumen y perspectiva de BTC. Compartido en la mejor comunidad @LokiCryptoSpace Viniendo de un canal bajista como todos sabemos, acumulando liquidez. Observamos el mapa de liquidación Heatmap de @tradingdiff, podemos ver una masa muy grande (Zona Roja).Continua en comentarios.


@tradingdiff Increíble análisis. El juego de liquidaciones siempre ofrece oportunidades emocionantes.

ANÁLISIS de BITCOIN para 2025, todo lo que ocurrirá (Vídeo clave que todos deben de ver)

@larutadelprecio @tradingdiff Sinceramente @tradingdiff y sus mapas de liquidez, son una joya infravalorada

El trabajo de @IvanPazChain y todo su equipo de @tradingdiff es extraordinario!!

📈Escenario Alcista Si BTC defiende 117K y rompe 118.5K – 119K con volumen, podría ir hacia 121K – 122K. Confirmación con cierre H1 > 119K. 📉 Escenario Bajista Si pierde 116.5K, retroceso probable a 115K – 114K. Ruptura de 114K abriría camino a 112K – 113K

Es increíble como estos datos pueden anticipar movimientos. Excelente herramienta de @tradingdiff

#BITCOIN ainda com liquidez na região dos #100k e com um forte suporte na região! Precisa engolir essa liquidez e sustentar acima dessa região, e se perder, será ruim para o mercado ( um pouco mais ) @tradingdiff

Trabajo duro y muchísima dedicación dan sus frutos una ves más. @IvanPazChain, Damian Coria, Monica y todo el equipo, sois unos cracks.

Here’s a quick video of me using the Liquidation Heatmap for BTC. Watch as I target 50x shorts getting liquidated, but I don’t place my long yet. I wait for those 100x longs to get wiped first. 🧠💥 Try the Liquidation Heatmap today

🗿Gracias a @tradingdiff Tienen la mejor herramienta que hay ahora mismo para saber dónde está la liquidez.


Trading Different: "Bitcoin es el gran ganador ante los aranceles impuestos por los EE.UU." Esta fue la más reciente entreviste que le realicé a @IvanPazChain CEO de @tradingdiff Lee más aquí ⬇️ https://es.cointelegraph.com/news/bitcoin-is-the-big-winner-in-the-face-of-us-imposed-tariffs-they-claim

Massive @tradingdiff liquidation cluster sits at 85K5, exactly the HL liquidation price 🚨 Everything aligns with this mf stop to be chased 🩸 But as posted previously, on a TA basis, this is still a SHORT. We've got a good entry at Saturday highs, so now we go risk free 🤝


Ahora veo que muchos hablan de Pools Liquidez y de Traders liquidados , nosotros iniciamos ha hablar de eso, no solo hablar de eso a construir las herramientas para predecir los movimientos y hacer la palabra carne desde el 2018 @tradingdiff @IvanPazChain Lo aprendieron de Nosotros, recuérdenlo !

🔍 Explorando herramientas de trading en #Bitcoin 📊 con Iván Paz, CEO de @tradingdiff

@tradingdiff gracias por apoyar a los nuevos Inversores en este salvaje mercado ! #BTC
The most precise Tools
We have created our own tools to develop unique strategies that allow us to differentiate ourselves in the market.
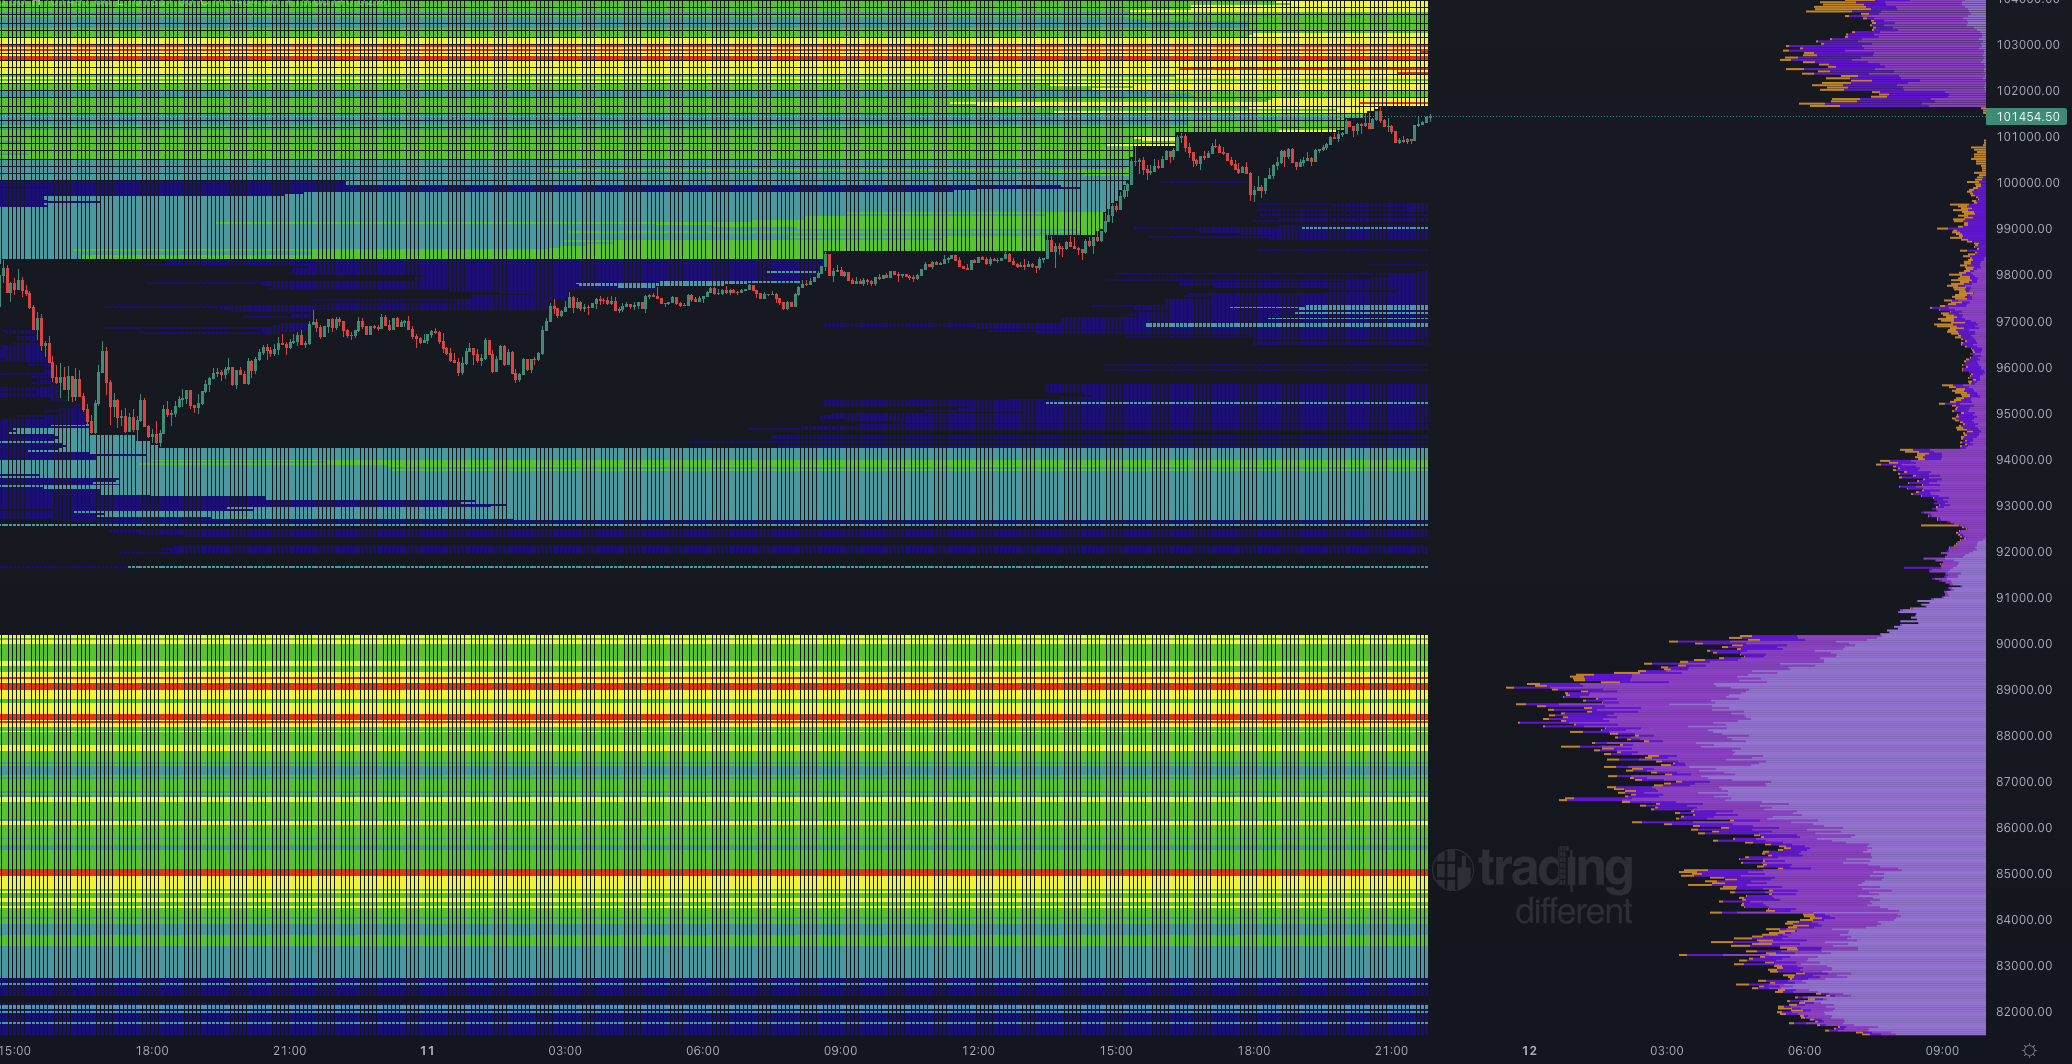
Liquidation Heatmap
Developed for:
-
Crypto:BTC/USDT ETH/USDT ADA/USDT AVAX/USDT BNB/USDT DOGE/USDT DOT/USDT POL/USDT TRX/USDT XRP/USDT SOL/USDT PEPE/USDT SUI/USDT LINK/USDT HBAR/USDT XMR/USDT LTC/USDT KAS/USDT XLM/USDT TON/USDT ZEC/USDT APT/USDT
-
Forex & Commodities:EUR/USD XAU/USD XAG/USD GBP/USD USD/JPY
-
Indexes:SPY/USD QQQ/USD DIA/USD
-
Stocks:MSFT/USD NVDA/USD AAPL/USD TSLA/USD MSTR/USD GOOGL/USD AMZN/USD META/USD AMD/USD
-
Anticipate the trend
- Algorithm that shows where the price would be most likely to go, forced by high frequency bots.
-
Know the bounce zones
- When the price moves towards the Pools, it liquidates the positions and ends up bouncing.
-
Optimize your operations
- Knowing this allows us to buy at minimum prices and sell at maximum prices.
-
Reduce your losses
- We know where most traders are going to lose, therefore we can identify a better area to place our stop losses.
-
Intuitive graphics
- TradingView's like interface.
-
Improve your vision of the market
- They are like X-Rays in the graph that allows to identify the market manipulation.


How does the Liquidation Heatmap work?
The Liquidation Heatmap from Trading Different is powered by a proprietary algorithm that processes real-time data from multiple liquidity providers and institutional-grade data sources. This allows us to generate a weighted average of all trades entering the market, avoiding reliance on a single source.
Using this aggregated data, the algorithm estimates the likely liquidation levels of open positions. While we don’t have exact information about the leverage used in each trade, our model applies advanced statistical and risk modeling techniques, developed and refined over more than 7 years of live performance across markets such as crypto, stocks, indices, and forex.
Thanks to this statistical approach, the Liquidation Heatmap has proven to be highly effective in identifying pressure zones in the market—areas where sudden moves are more likely due to forced liquidations.
Liquidity indicators like Bookmap, Atas, TensorCharts, TradingLite, etc., may look similar at first glance, but the Liquidation Pools are very different. In these indicators the Order Book is shown, that is, the liquidity outside the market, in the Liquidation Pools we show the liquidity inside the market.
Our algorithm calculates, with different probabilities, where the Stop Loss of over-leveraged traders will be liquidated or executed. We know that 90% of those traders will lose and based on that we develop our strategies.
Liquidation Simple Map
Visual representation that shows price zones where large amounts of leveraged positions are at risk of liquidation.
-
Detect high-liquidity zones
- Identify price levels with large accumulations of pending liquidations that act as magnets for the market.
-
Anticipate sharp movements
- Visualize where price can accelerate or bounce due to cascading mass liquidations.
-
Optimize your entries and exits
- Place strategic stop-losses and define take-profits in high-liquidity zones to reduce slippage.
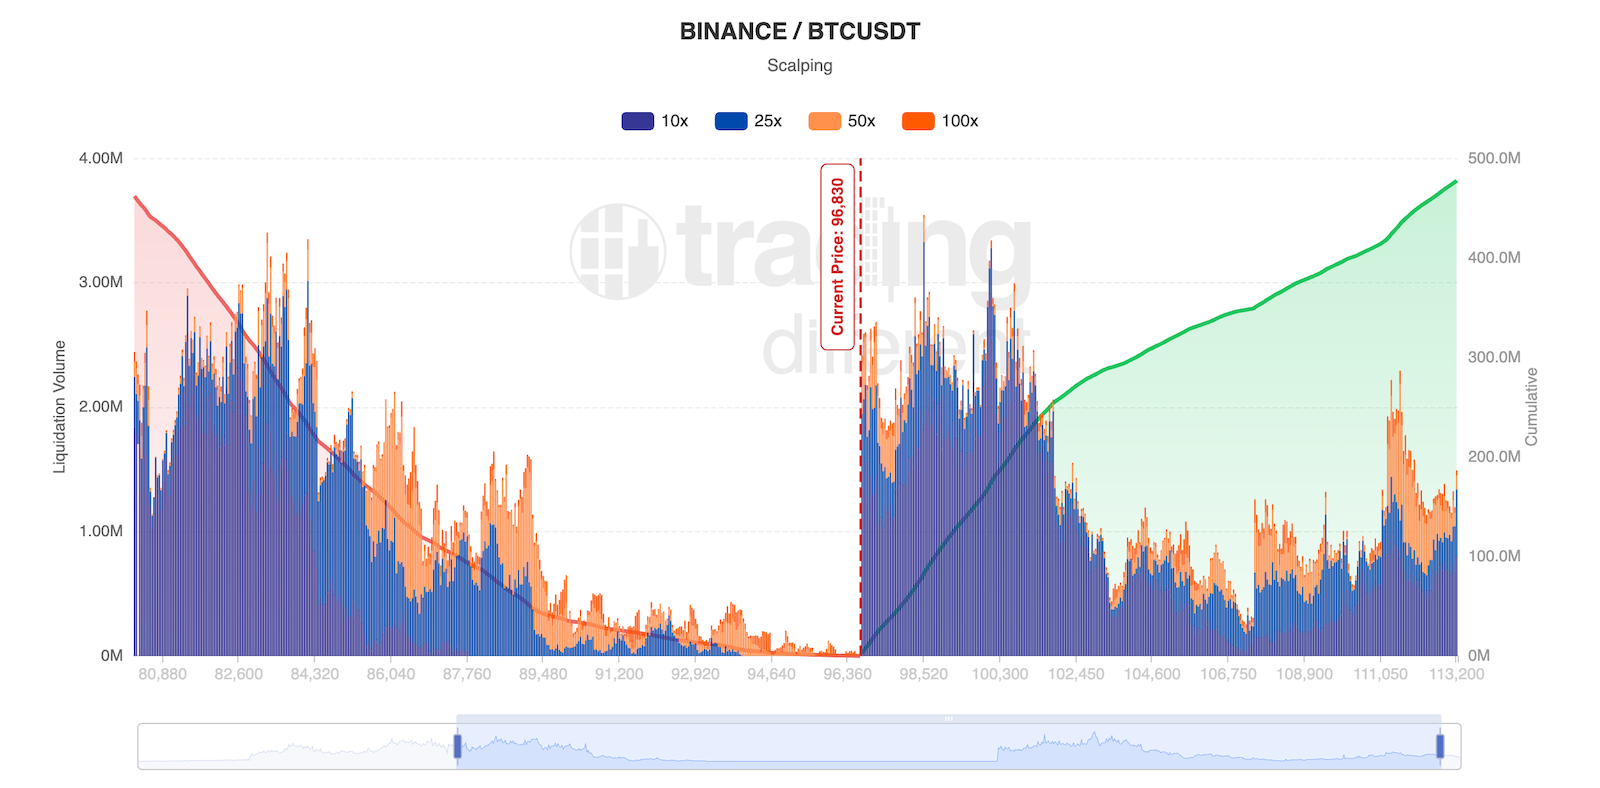
Liquidation Profile
Liquidation levels grouped by leverages
-
High-Liquidity zones
- Quickly detect the price levels with the highest accumulated liquidity.
-
Multiple leverages
- Visualize liquidity for 100x, 50x, 25x and 10x leverages.
-
Customizable leverages and colors
- Decide what leverages you want to show/hide and its colors.
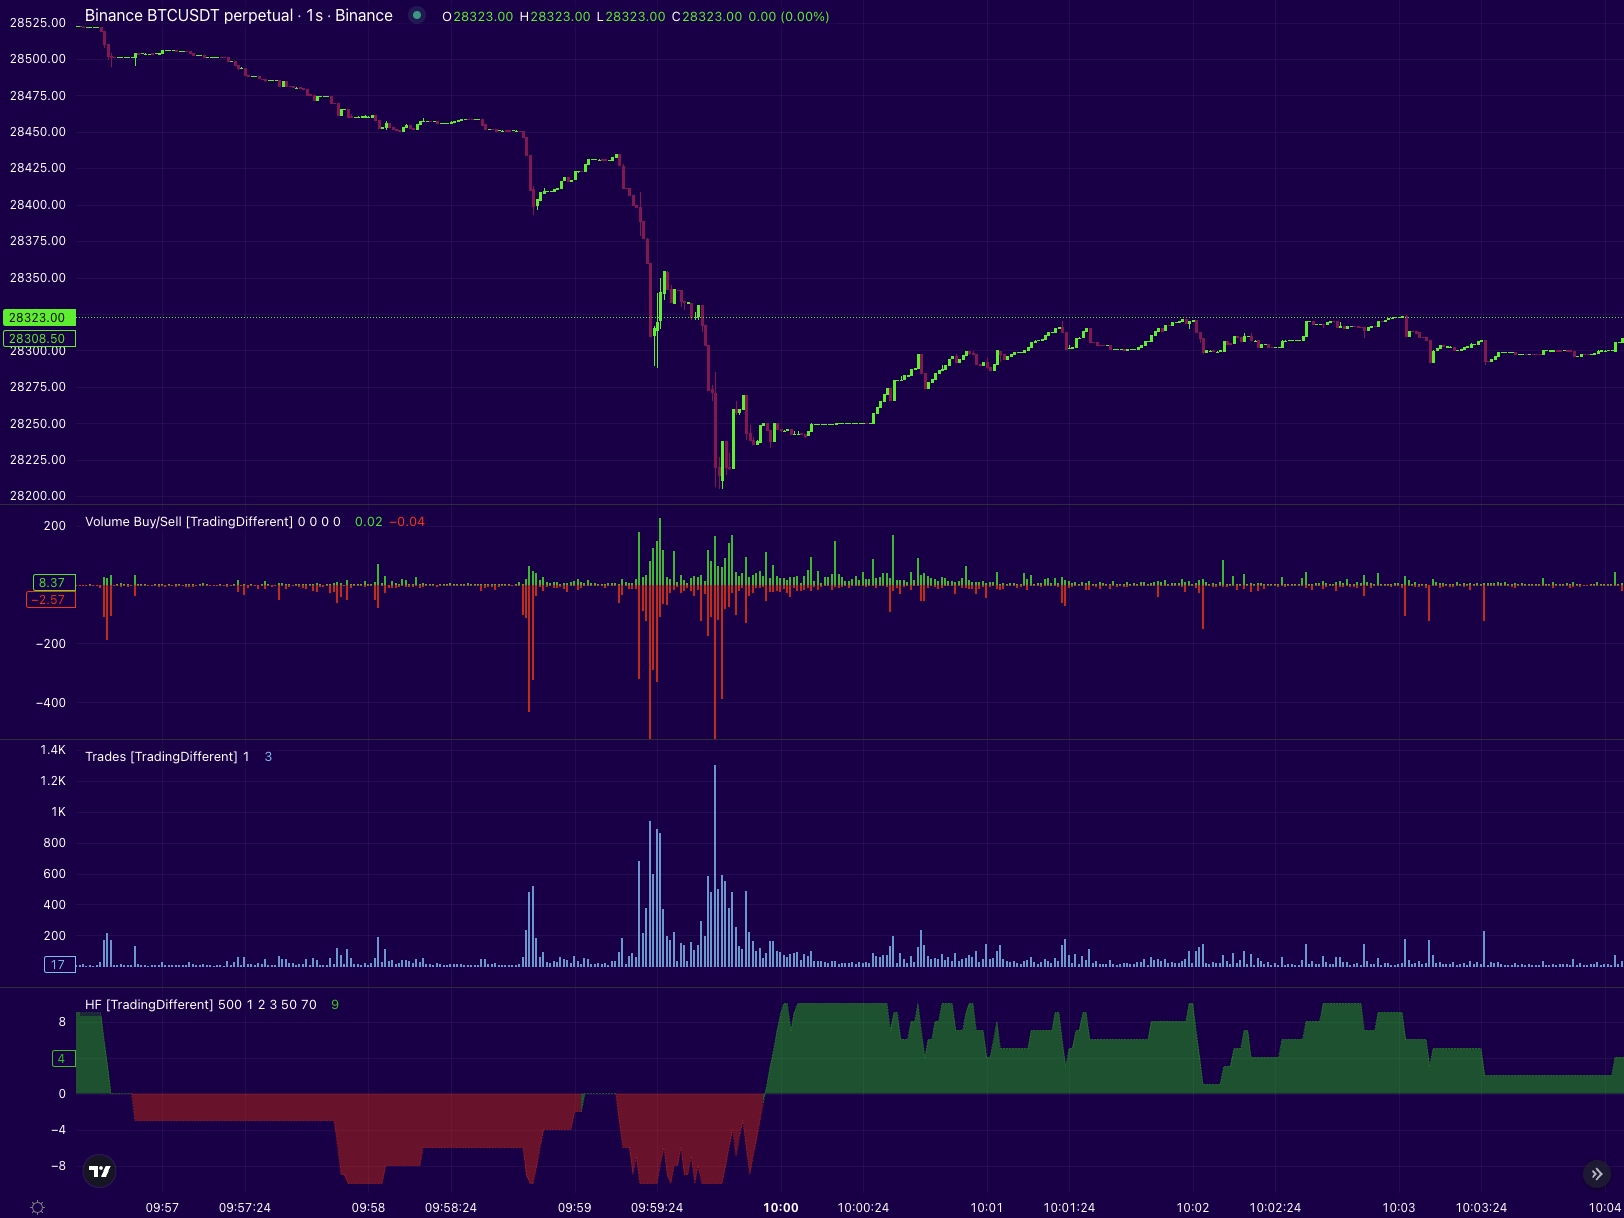
High Frequency Chart
Reading of how the high frequency bots of the big operators are operating. For all cryptos listed in Liquidation Heatmap.
-
1 second interval
- Reading of the buy/sell orders that enter the market every millisecond, summarized in a graph of seconds.
-
High frequency indicator
- Indicator that accumulates and summarizes the direction in which the high-frequency bots are operating. It can be configured according to market circumstances.
-
Trading technique
- We seek to operate in the same way that high frequency bots do.
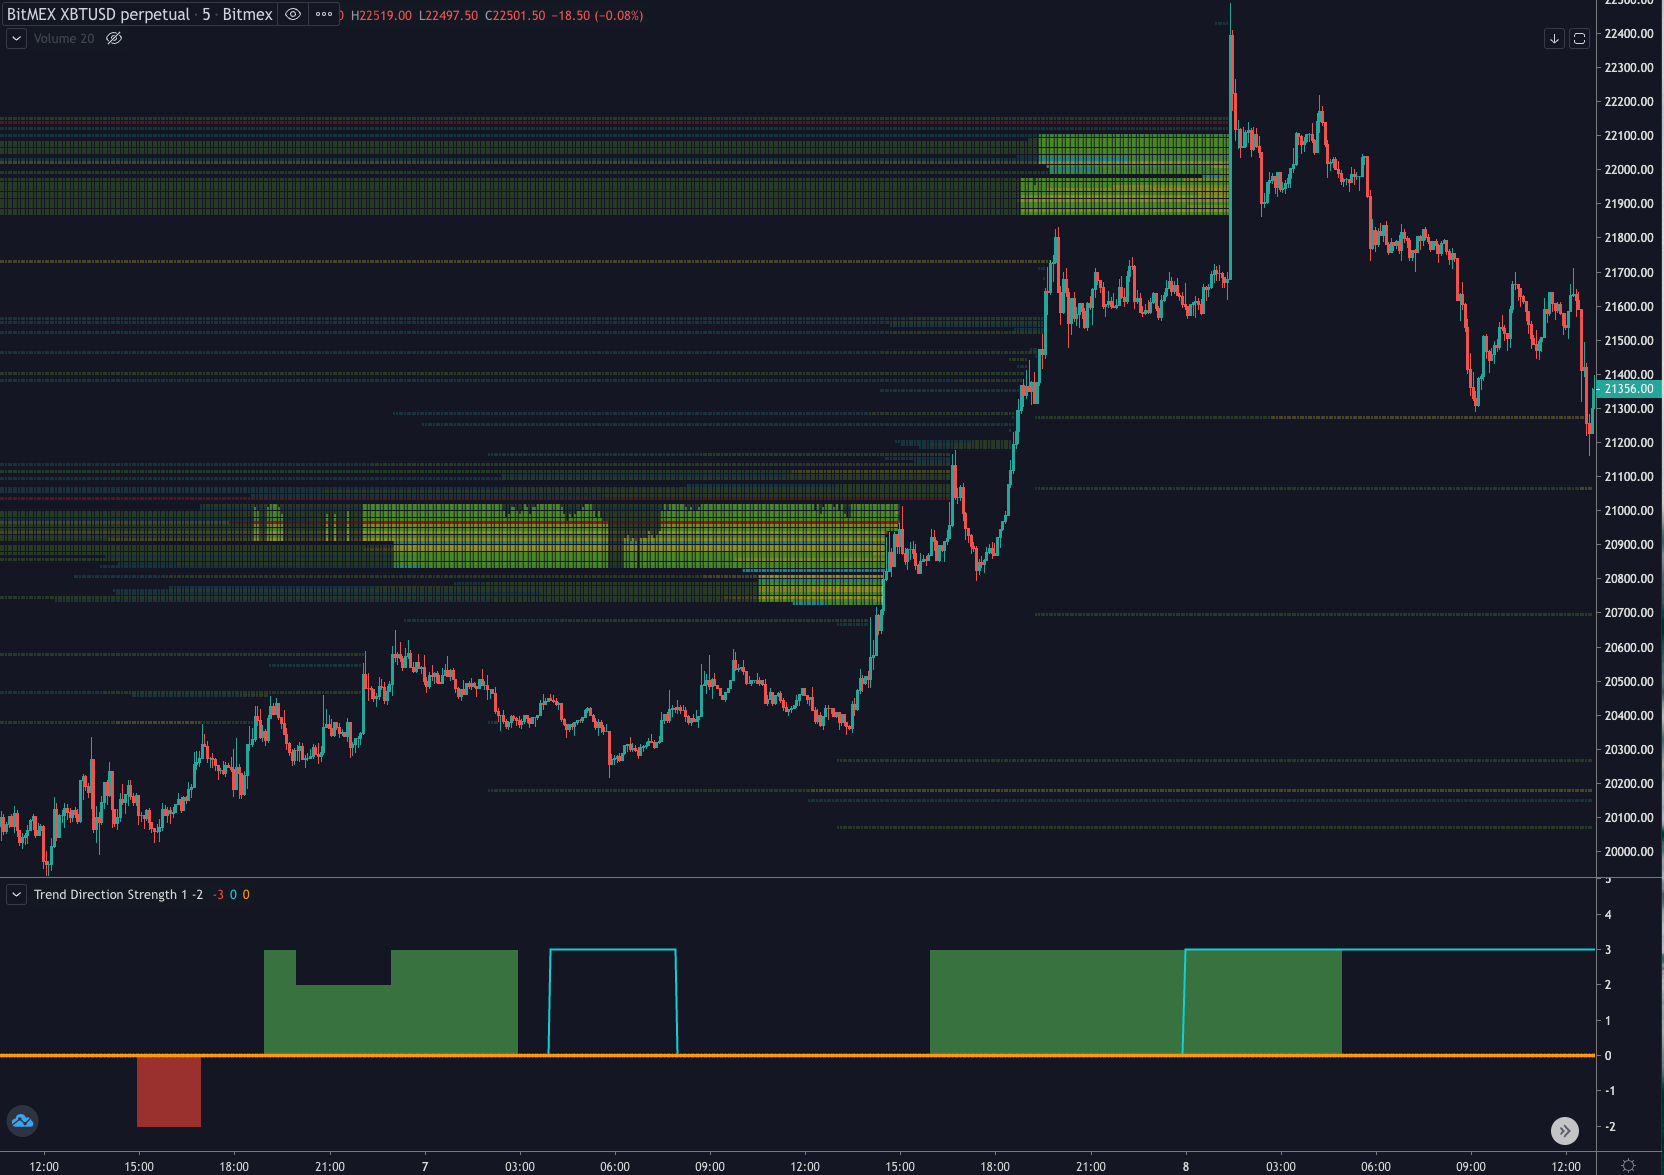
TrenDiff: Trend indicator
Indicator that marks the main trend of the market and helps us to operate in the same direction, seeking the Liquidation Pools as Take Profit targets. Only available for Bitcoin.
-
Long and Short Trends
- Indicates Long and Short trends for extended movements.
-
Targets
- It is complemented by the Liquidation Pools, which mark the Take Profit zones.
-
TrenDiff Strategy
-
Backtested strategy with more than 70% effectiveness.
View strategy
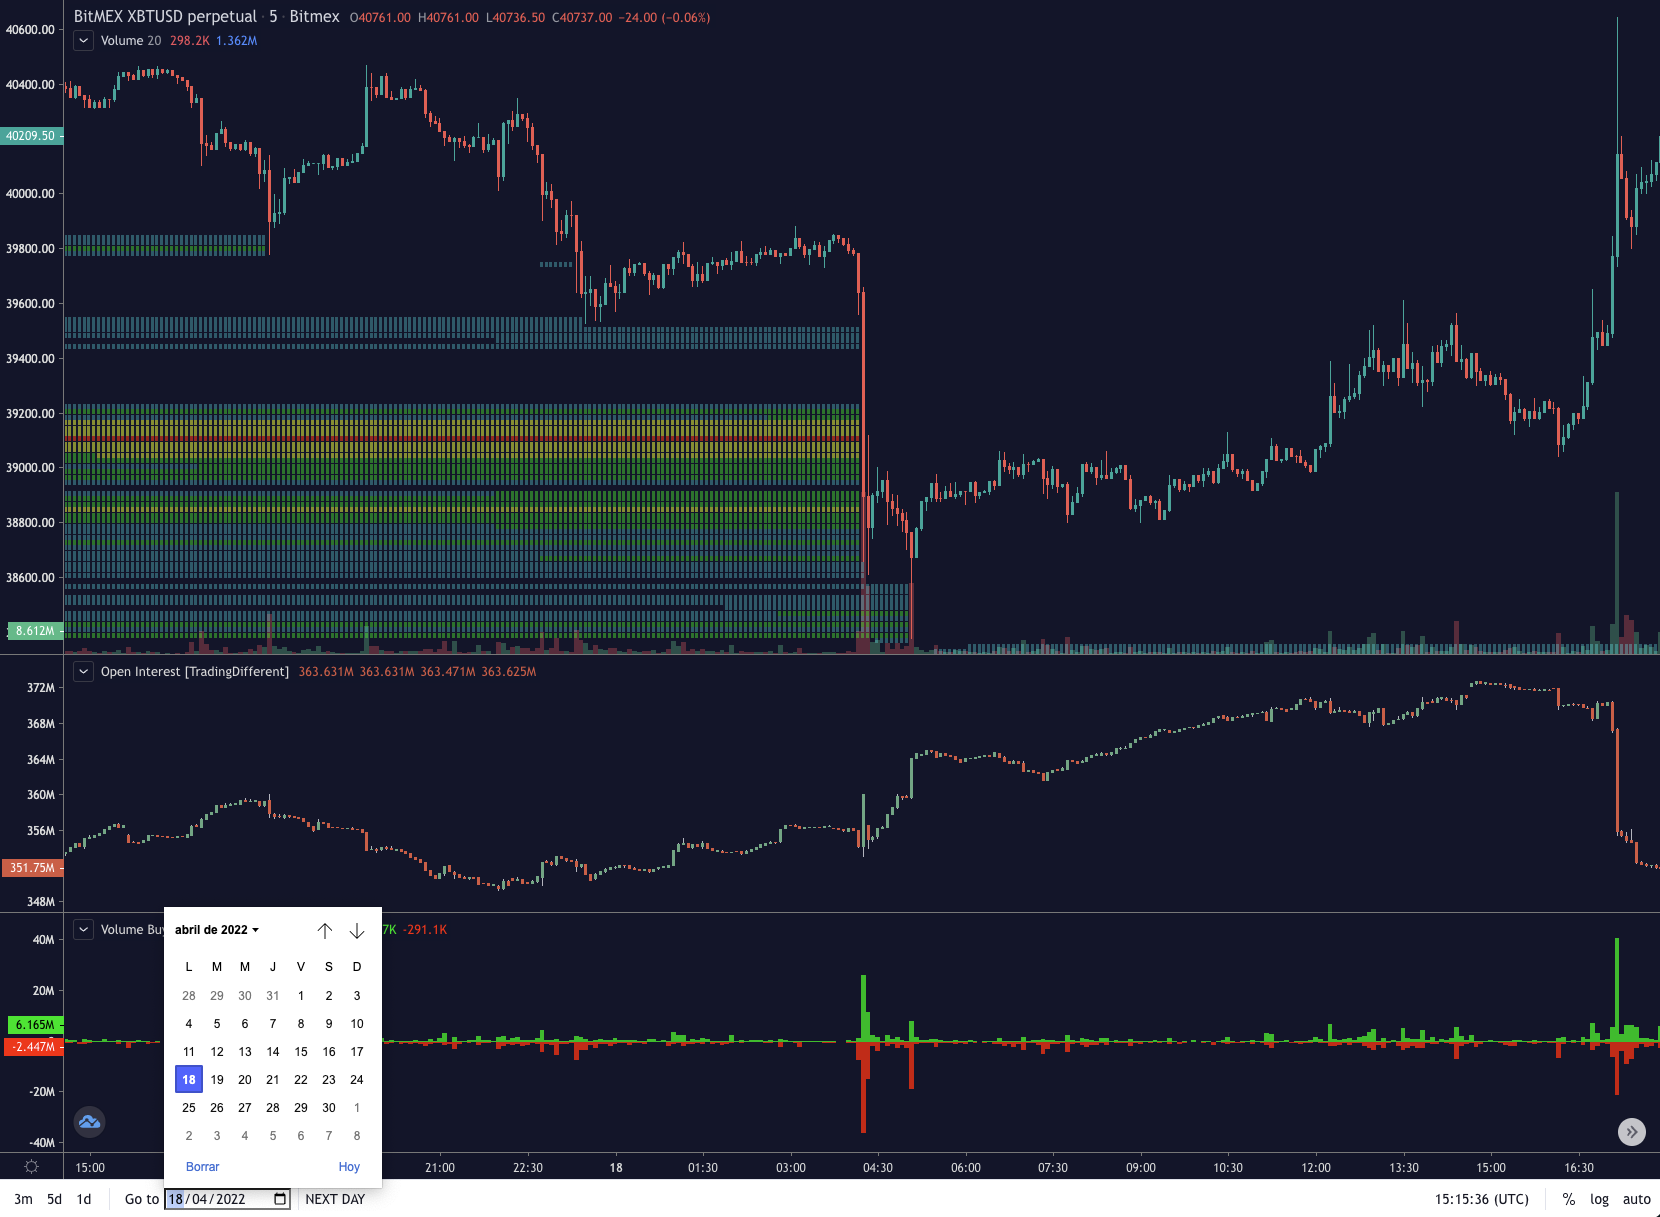
Historical Chart
Bitcoin price history since May 2019 (BitMEX), with all our indicators to be able to detect patterns, build strategies and backtest them.
For all cryptos listed in Liquidation Heatmap.
-
Multi timeframe
- Behavior of the price in multi timeframes: 5m, 15m, 1h y 4h.
-
All our indicators
- Open Interest, Volumen Buy/Sell, Liquidations, TrendDiff, etc.
-
Search calendar
- It allows you to select dates and browse the Bitcoin history.
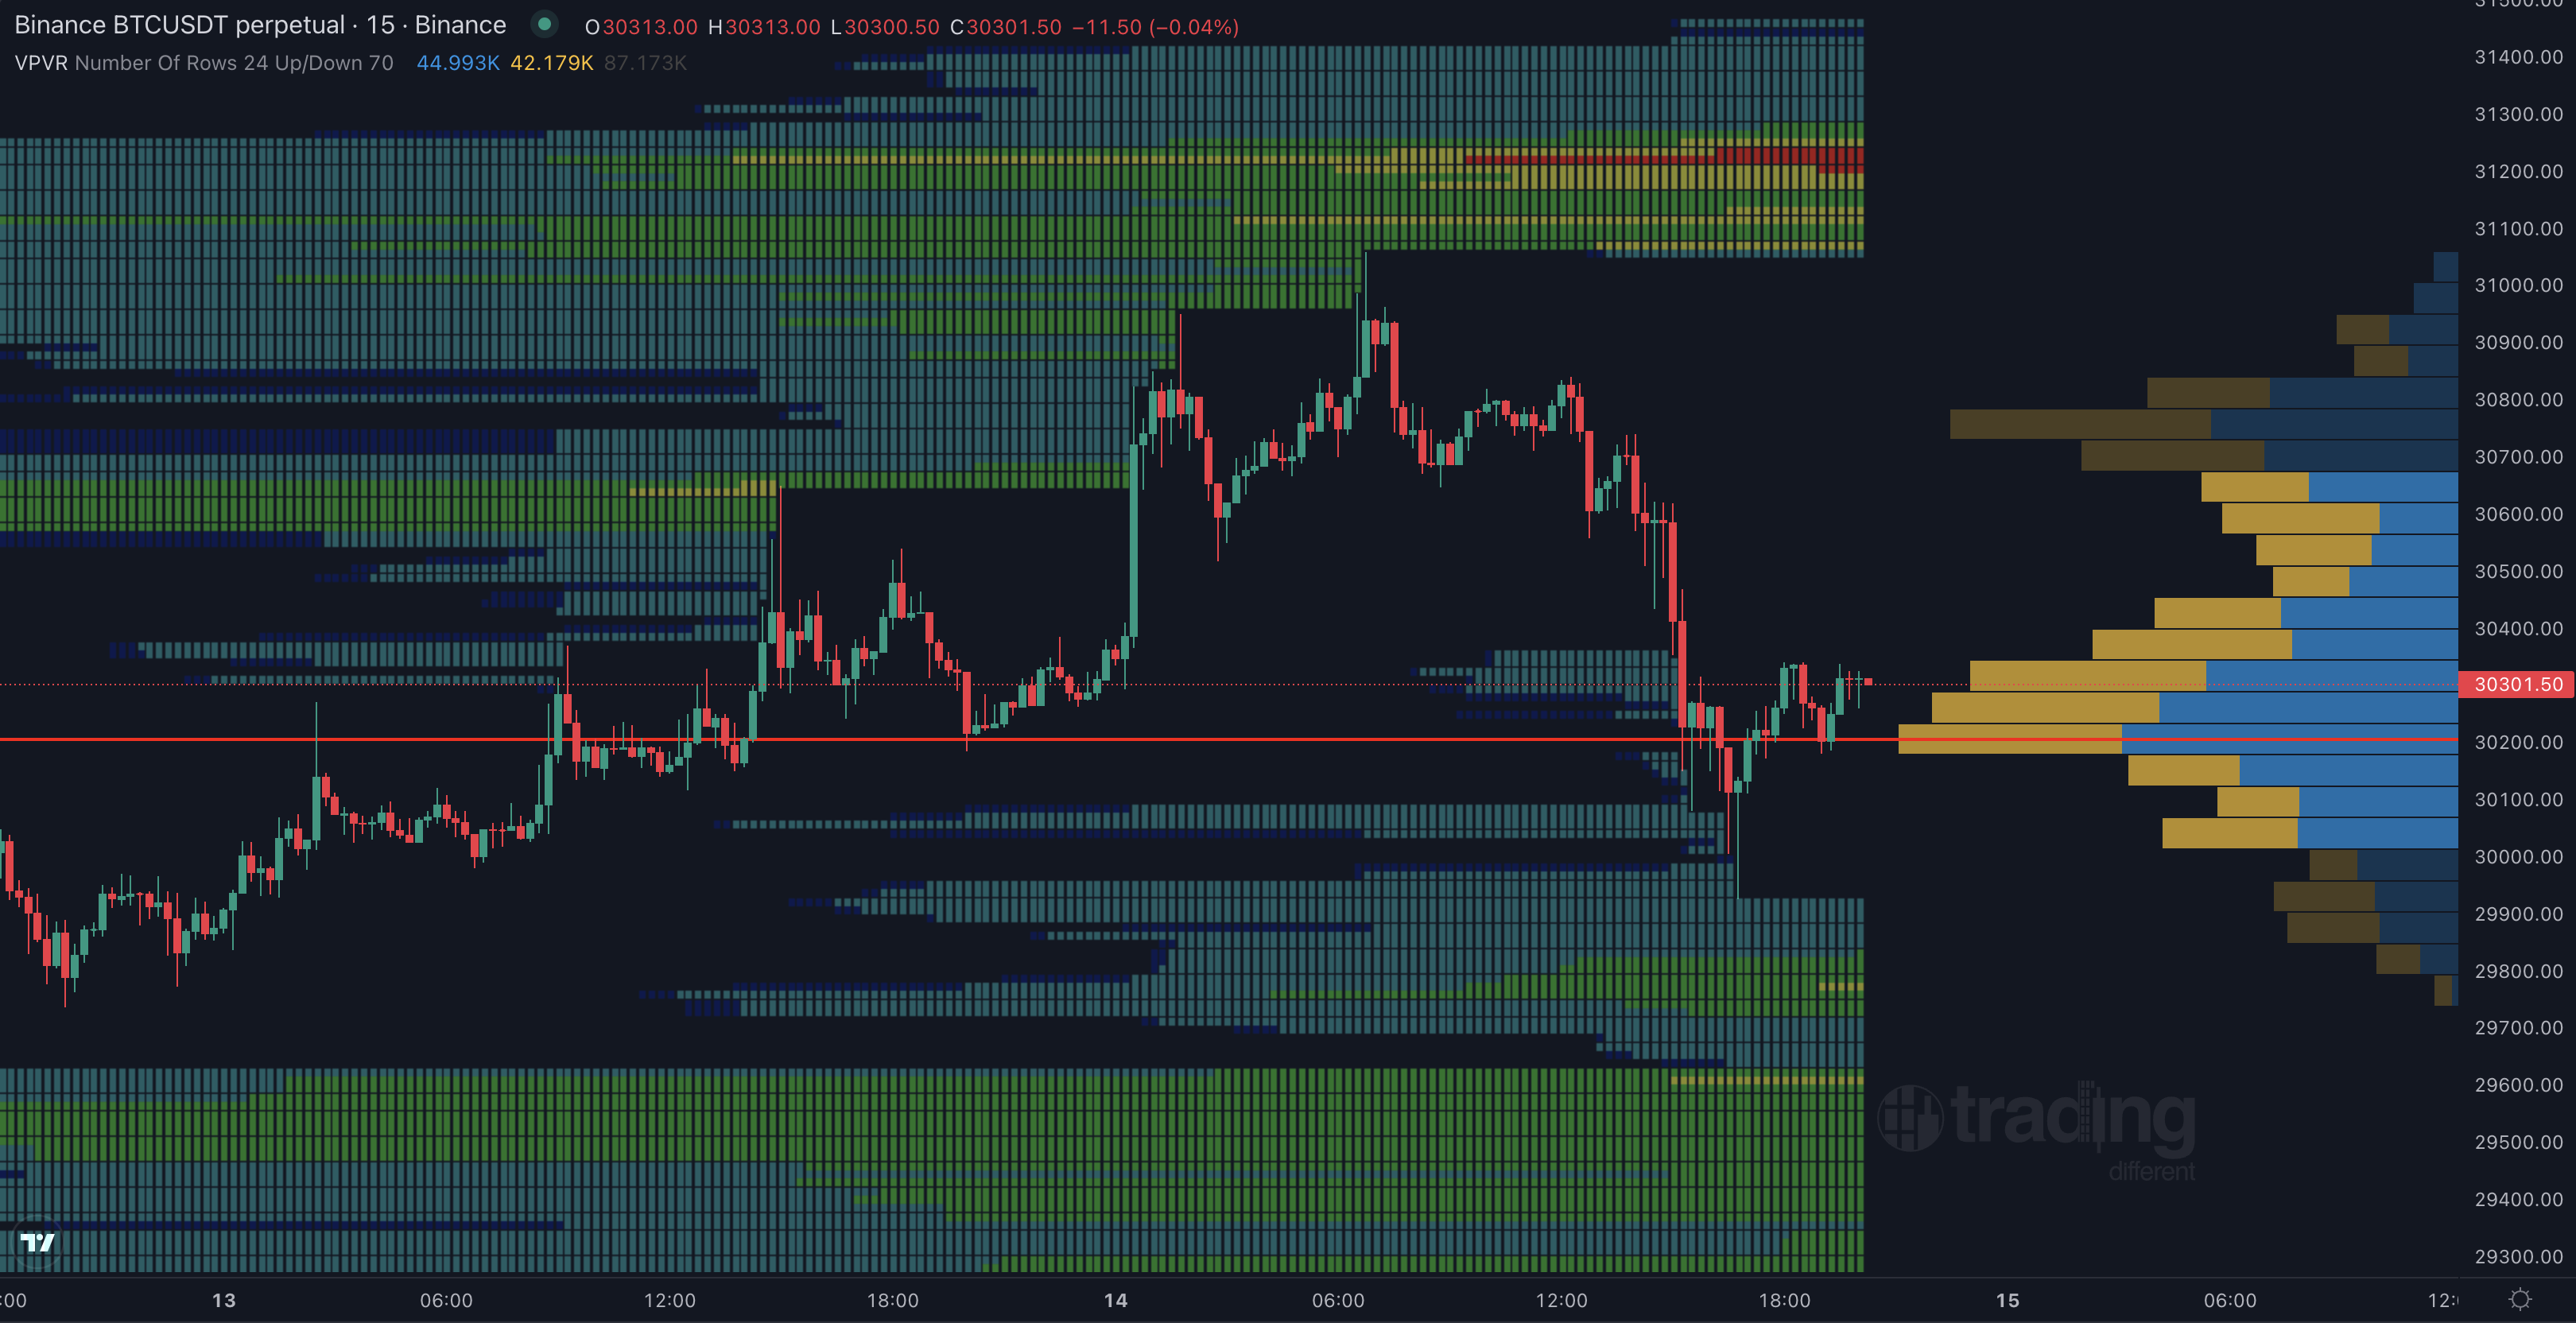
Volume Profile
Volume grouped by price levels.
For all cryptos listed in Liquidation Heatmap.
-
Point of Control (POC)
- The price level with the highest traded volume.
-
Profile High/Low
- The highest/lowest reached price level during the specified time period.
-
Value Area (VA)
- The range of price levels in which a specified percentage of all volume was traded during the time period.
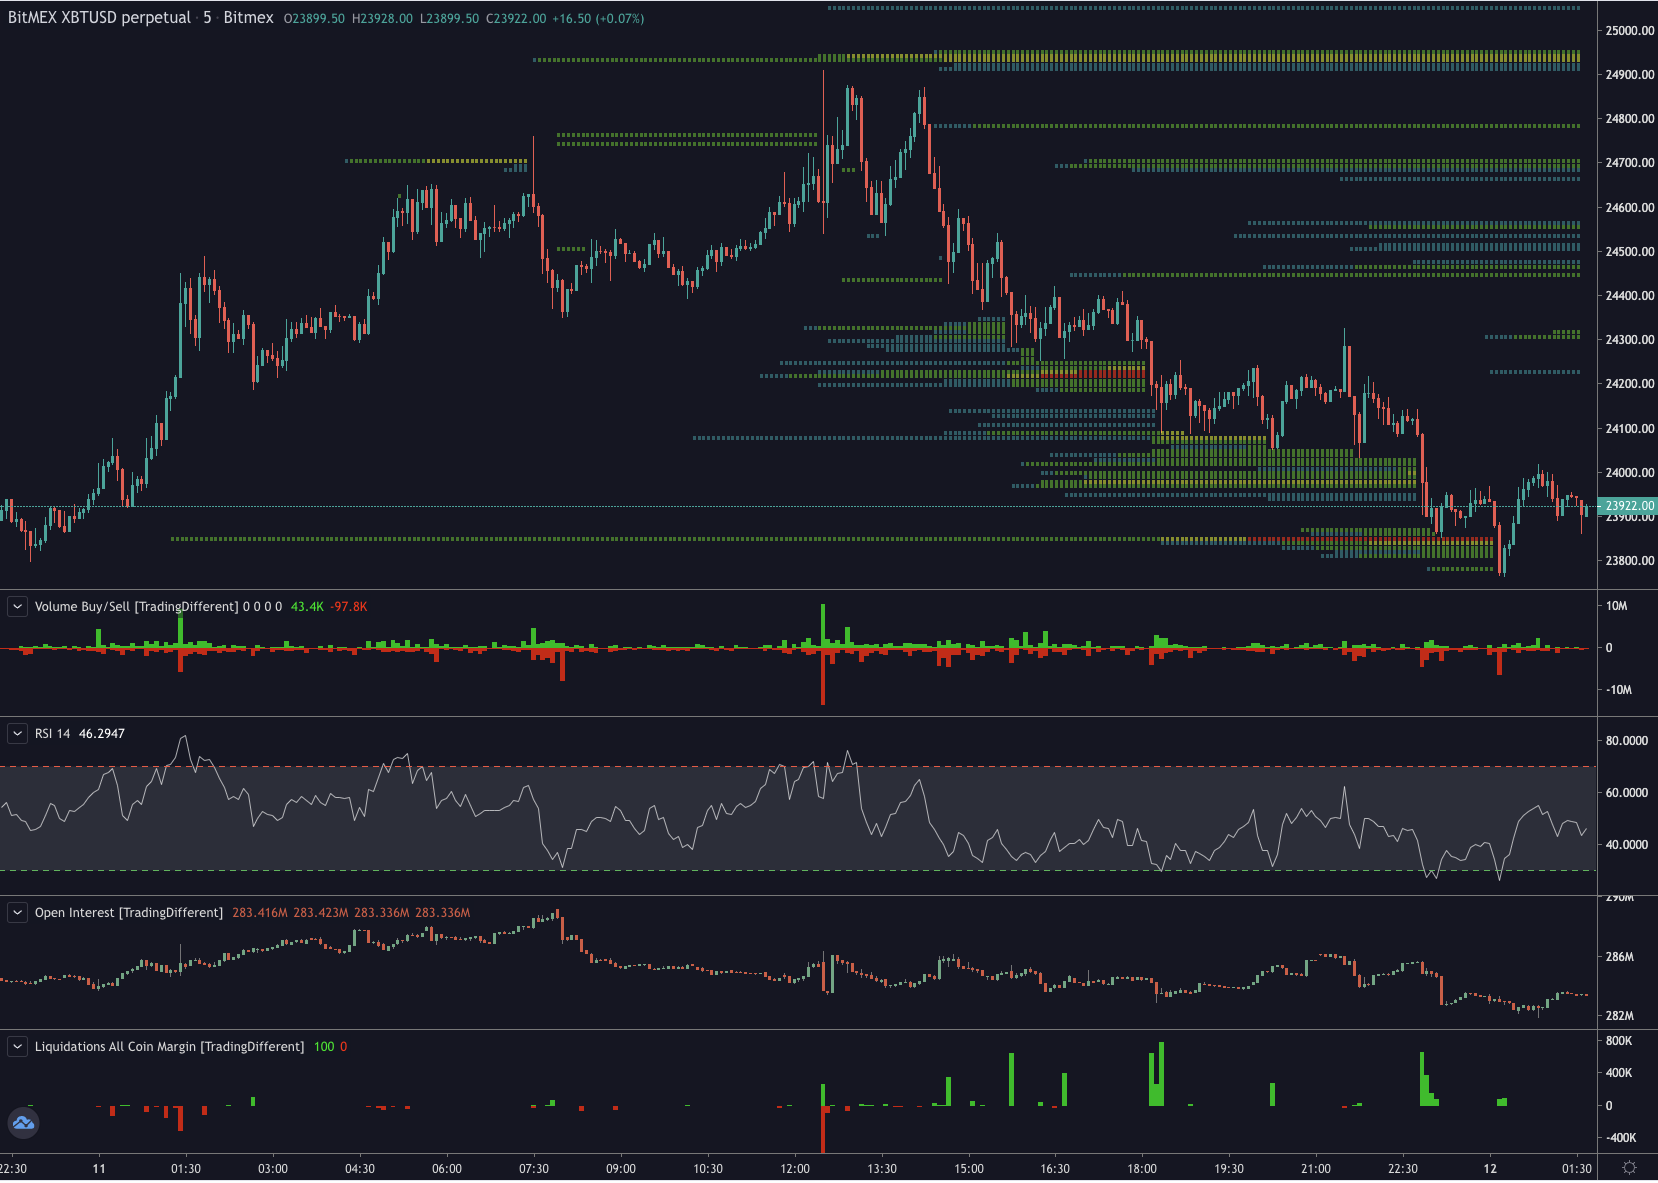
More Indicators
For all cryptos listed in Liquidation Heatmap.
-
Discriminated volume of buy and sale
- Buy & Sell market orders
-
Real-time liquidations
- Liquidations reported by exchanges, with margin in Bitcoin and stablecoins.
-
Open Interest
- Open interest on Bitcoin futures, in real time.
-
TradingView Indicators
- All indicators available in TradingView.
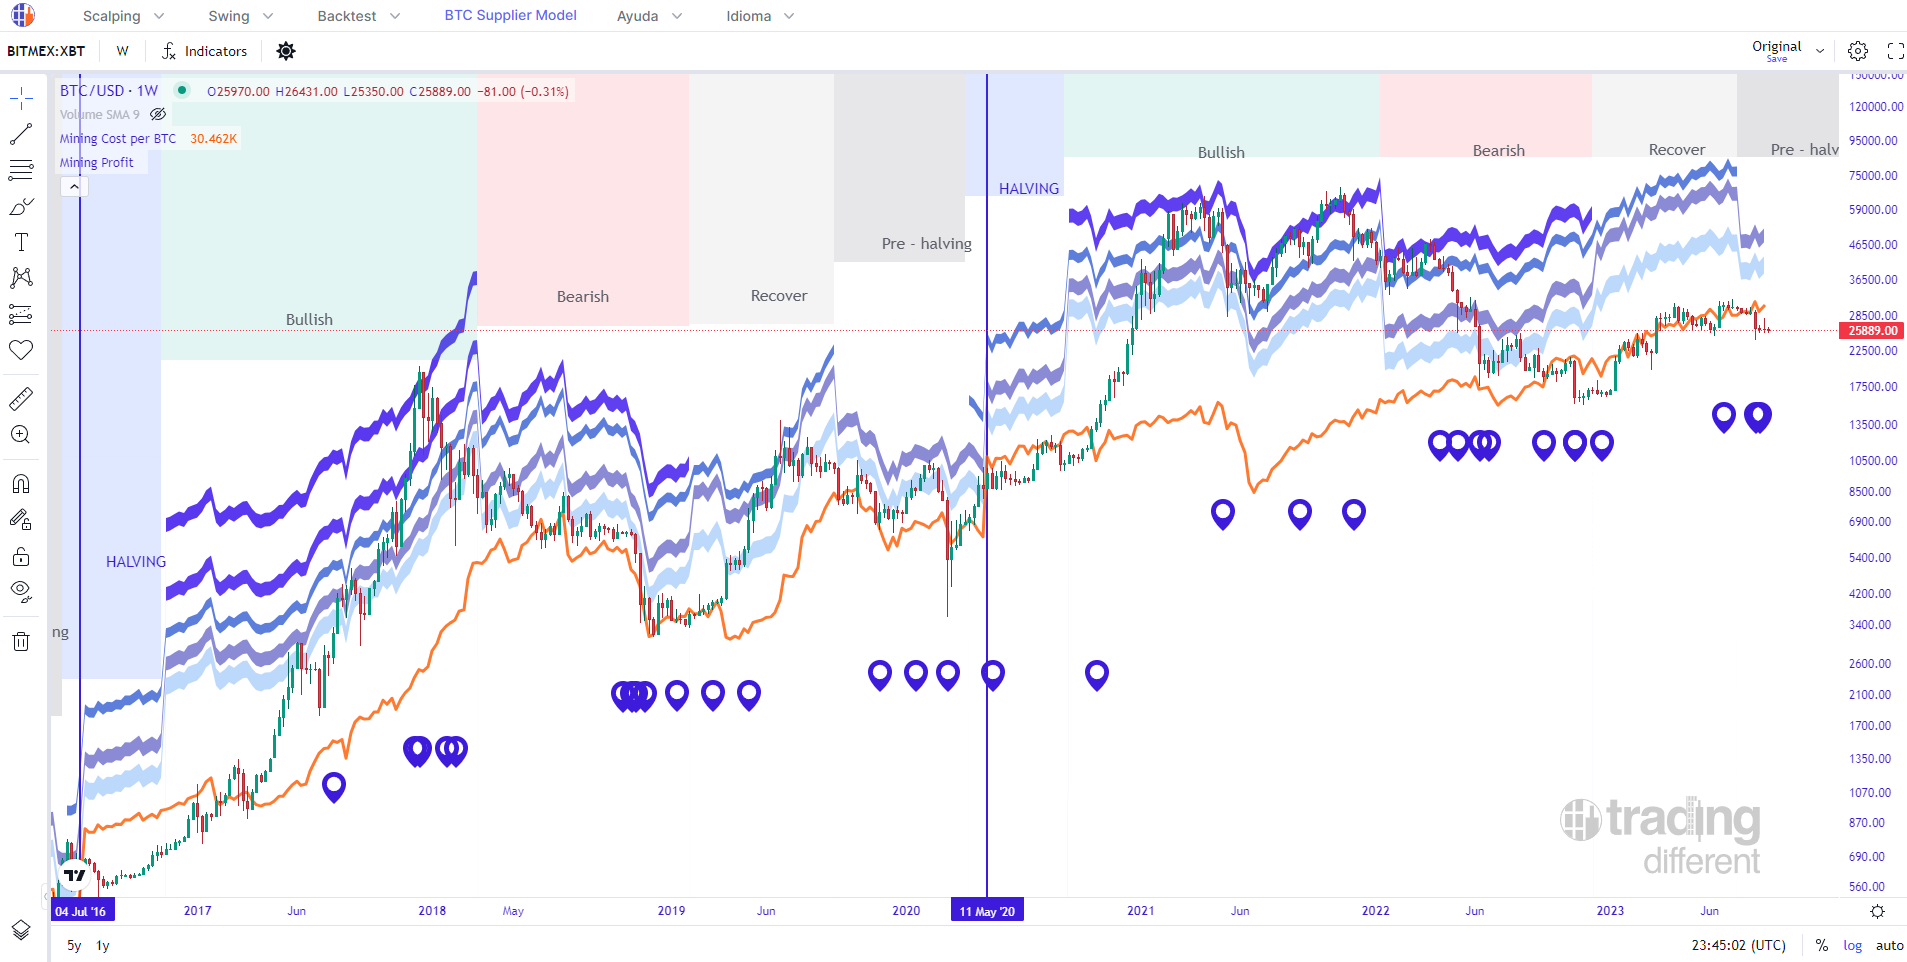
BTC Supplier Model
Total mining cost of 1 BTC with highlighted market stages and mining profit zones.
-
Mining Cost
- Total cost to produce 1 BTC, considering electricity, equipment amortization, maintenance, refrigeration, taxes, rents, administration, etc.
-
Mining Profit
- Miners profit-taking zones for the different market stages.
-
Important events
- Key milestones throughout BTC history right on the chart.
-
Multi timeframe
- Price behavior in 1D and 1W timeframes.
Create your own quantitative strategies
Transform your operations into a quantitative trading system, complementing the indicators that you frequently use with the Liquidation Pools.

Liquidation Pools + RSI + BB

Liquidation Pools + EMA + Elliott

Liquidation Pools + ADX + MACD

Liquidation Pools + Fibo
Bitcoin & Ethereum Future Contracts
CME Futures Free
Explore key data, updated charts, and professional analysis of Bitcoin & Ethereum futures contracts on CME. Visualize open interest, volume, institutional positioning, and dynamics influencing the price of Bitcoin & Ethereum from a traditional market perspective.
Open charts


BTC Spot ETF Holdings and more
ETF & Companies: Bitcoin Holders Free
Track the latest Bitcoin holdings in publicly traded and private companies, ETFs and countries, including BlackRock, Fidelity, Grayscale and more.
Open chartsSupply & All Time High (ATH) Analysis
Crypto Emission Rate Free
Conduct a financial analysis to shortlist the best cryptocurrencies and optimize the construction of your portfolio.
Know the evolution of each cryptocurrency's supply and its emission rate.
Try it now Analysis")


Market Cap & Supply Evolution
Bitcoin vs Gold Free
Explore a detailed comparison of Bitcoin vs Gold in terms of market cap and historical supply evolution.
Open chartsAnalyse your strategy
Risk Calculator Free
Test your strategy numbers and understand the importance of a good Risk/Reward ratio and the impact of a recurring fee in your strategy results.
Try it now


Trending altcoin of the moment
On Fire Heatmap & HF Free
The best altcoin of the moment and the one that is generating the most profits. Analyze it with the Liquidation Heatmap & the High Frequency Chart totally free.
Open chartBitcoin Whales on DEX
Hyperliquid: Liquidation Heatmap, Whales positions and High Frequency Free
Explore actual liquidation levels up to 40x.
Analyze High Frequency bots and detect larger players.


First Principle
Absolute truths in trading
- Futures markets are a zero-sum game: one's gain is another's loss
- The crypto market is unregulated and therefore subject to manipulation.
- The crypto market is poorly liquid.
- 90% of traders lose money.
With these premises we developed the Liquidation Pools, an indicator that allows us to anticipate manipulations, knowing the areas where most traders will lose. Using that information, we develop our strategies.
Trade to your advantage
Use unique indicators
Build your own strategies
Be different
Media partners
Trading Different in the media
Find out about the repercussions of our news in the media


Pricing
Our Plans
We have plans that adapt to the needs of each person.
Are you a trader? Are you a holder? Choose yours!

Free Pack
Are you a crypto enthusiast or newcomer? Register now and try our free tools.
Holder Pack
Tools focused for Bitcoin Holders.
Trader Pack
All the necessary tools and indicators to start improving your trading strategies.
Trader Pack 3 MONTHS
You save 10% -$27$80 /month
Total: $240
Trader Pack 6 MONTHS
HOT SALE Extra 25% OFFTrader Pack 12 MONTHS
HOT SALE Extra 25% OFF| Compare plans | Free Pack | Holder Pack | Trader Pack |
|---|---|---|---|
| Liquidation Heatmap | |||
| Symbols | Bitcoin | Bitcoin, Supported Altcoins* | |
| Timeframes | 1h, 15m, 5m | 1D, 4h (Swing only) | 1D, 4h, 1h, 15m, 5m (Swing & Scalping) |
| Leverages | Up to 40x (Hyperliquid) | 3x, 5x, 10x, 25x | 3x, 5x, 10x, 25x , 50x, 100x |
| Crypto Exchanges | Binance | Binance, BitMEX, Bybit, Deribit | |
| HyperLiquid DEX (Bitcoin) | |||
| Forex | XAU/USD (GOLD). 1D timeframe only | EUR/USD, XAU/USD, XAG/USD, GBP/USD, USD/JPY | |
| ETFs | SPY (SP500). 1D timeframe only | SPY, QQQ, DIA | |
| Stocks | MSFT, NVDA, AAPL, TSLA, MSTR, GOOGL, AMZN, META, AMD | ||
| Liquidation Simple Map | |||
| Liquidation Profile | |||
| BTC Supplier Model | |||
| Crypto Emission Rate | |||
| Bitcoin vs Gold | |||
| ETF & Companies: Bitcoin Holders | |||
| CME Futures | |||
| On Fire Heatmap & HF | |||
| Risk Calculator | |||
| Discord & Zooms | |||
| High Frequency Chart | |||
| Historical Chart | |||
| TrenDiff Indicator | |||
|
Buy/Sell Volume |
|||
* Supported Altcoins: ETH, ADA, AVAX, BNB, DOGE, DOT, POL, TRX, XRP, SOL, PEPE, SUI, LINK, HBAR, XMR, LTC, KAS, XLM, TON, ZEC, APT
Affiliates Program
We have a collaboration plan for influencers and references of trading communities. They will be able to access all our tools and obtain exclusive benefits.Request access to the Affiliates Program
Whoops! Something went wrong.
We have received your message. We will contact you shortly.
Contact us
Personalized attention to find out more about our developments
- soporte@tradingdifferent.com
- Telegram
- Or write us on Telegram
