Article
Bitcoin under pressure: a whale bets on the upside amid global tension
Geopolitical tension is once again shaking the markets. Bitcoin is rebounding, but without volume or conviction, while d…
See where leveraged traders are most exposed and where liquidations may trigger before price gets there.
 BTCUSDT
 ETHUSDT
 SOLUSDT
 EURUSD
 XAUUSD
 XAGUSD
 SPY
SPY
 QQQ
QQQ
 DIA
DIA
 NVDA
NVDA
 MSTR
MSTR
 TSLA
TSLA
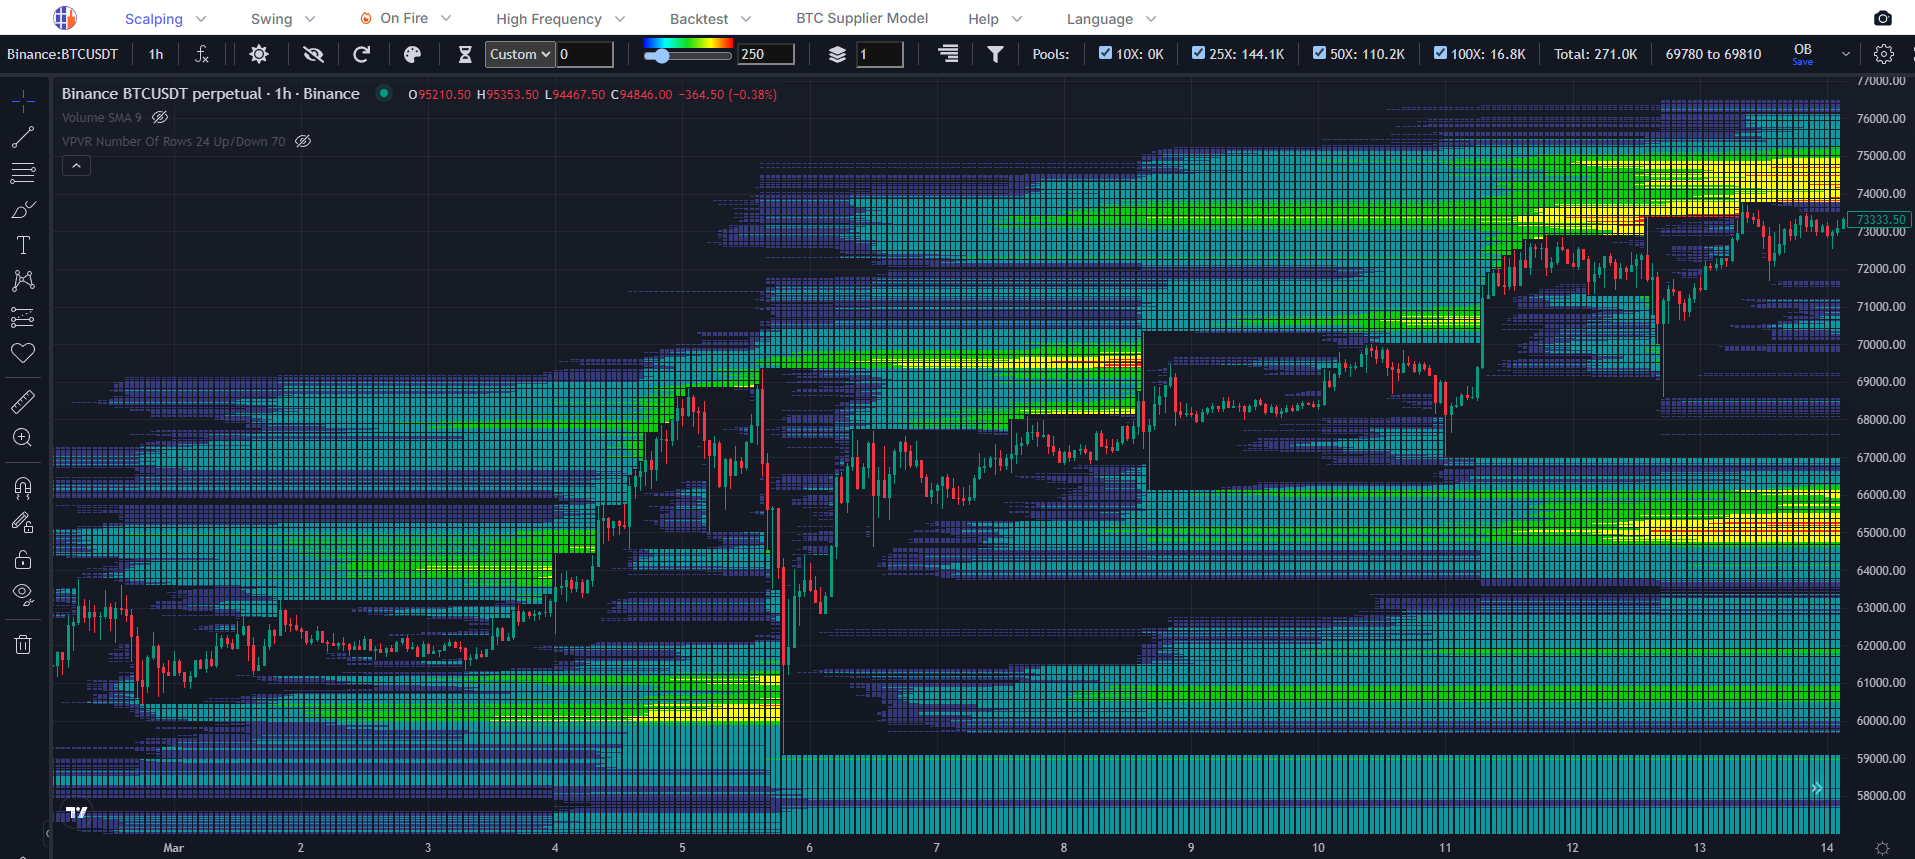
Liquidity sits where stops and leverage are stacked and most of it sits hidden. Wicks, flushes, and "random" stop-outs are often leveraged capital being harvested where it's most exposed. Trade blind, and you become the liquidity.
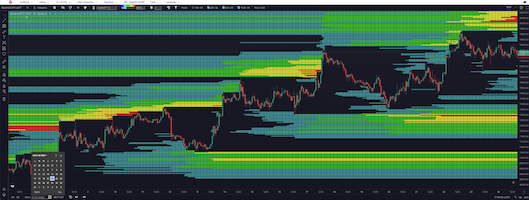
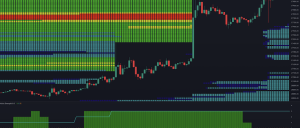
You see where over-leveraged positions sit, and where the next liquidation cascade is most likely to land. The Liquidation Heatmap shows where leveraged traders are most exposed before price gets there.
The brighter the zone, the more leveraged capital sitting at that price.
Above price: shorts get liquidated if price pushes up.
Below price: longs get liquidated if price drops.
Price gravitates toward leverage. The brighter the zone, the stronger the pull.
That's where retail keeps donating stops, and where the next sweep is most likely to land.
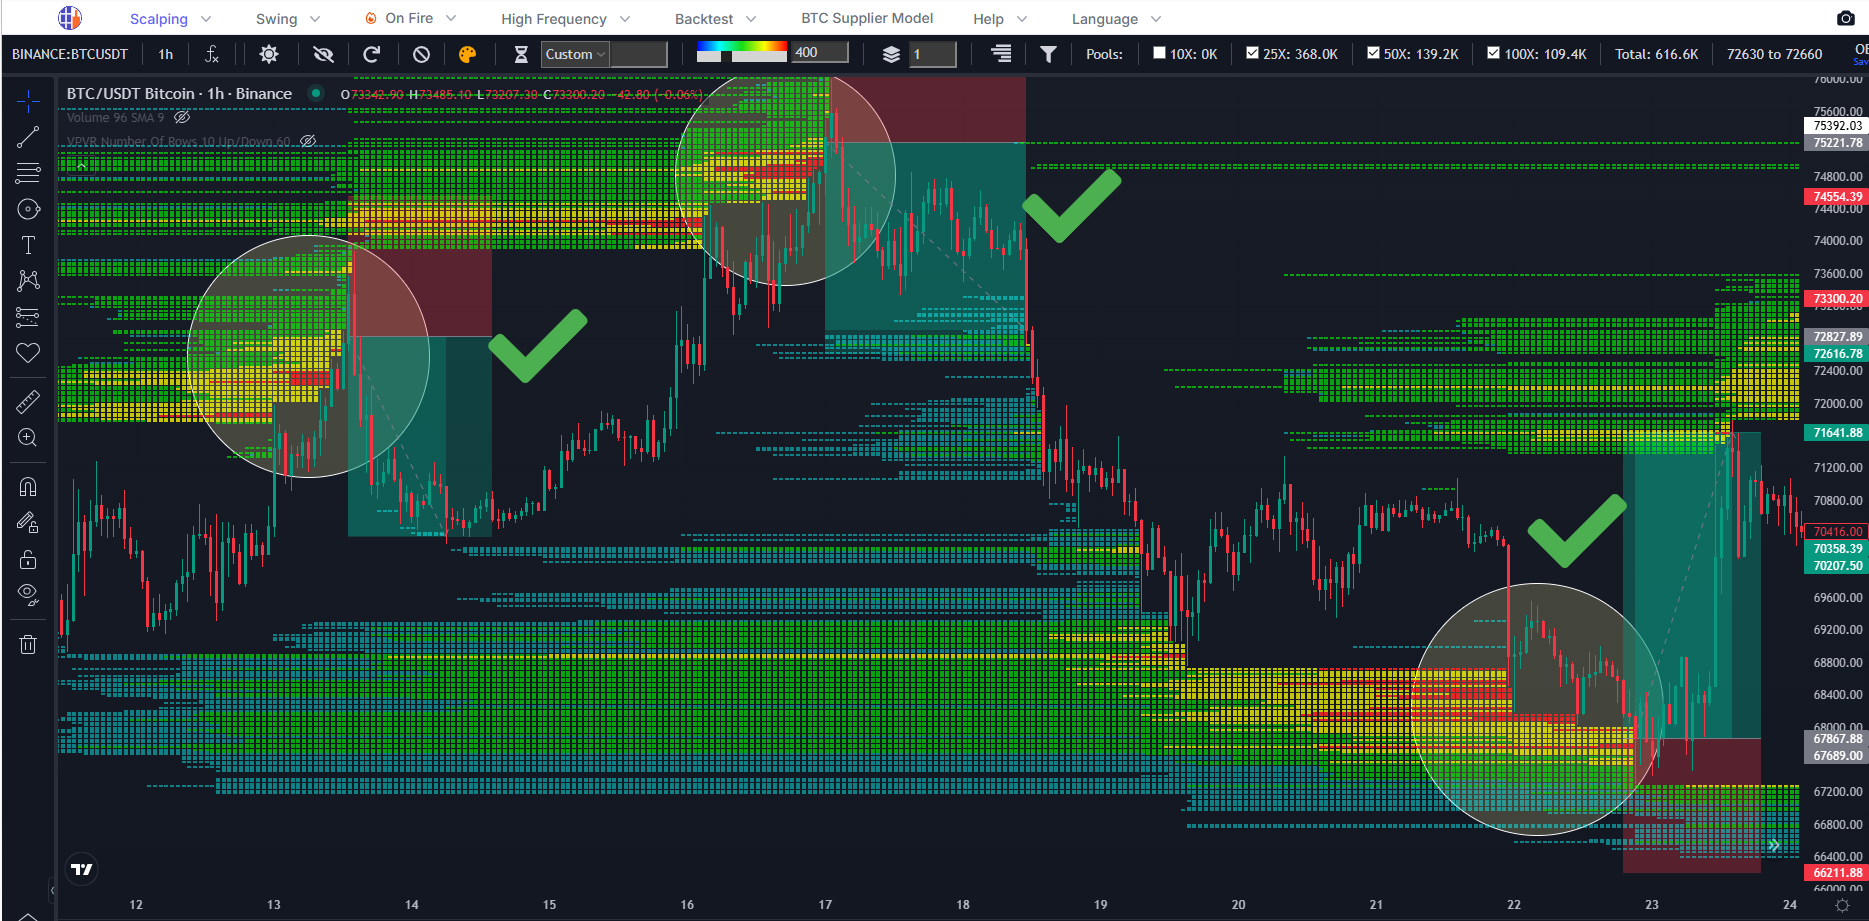
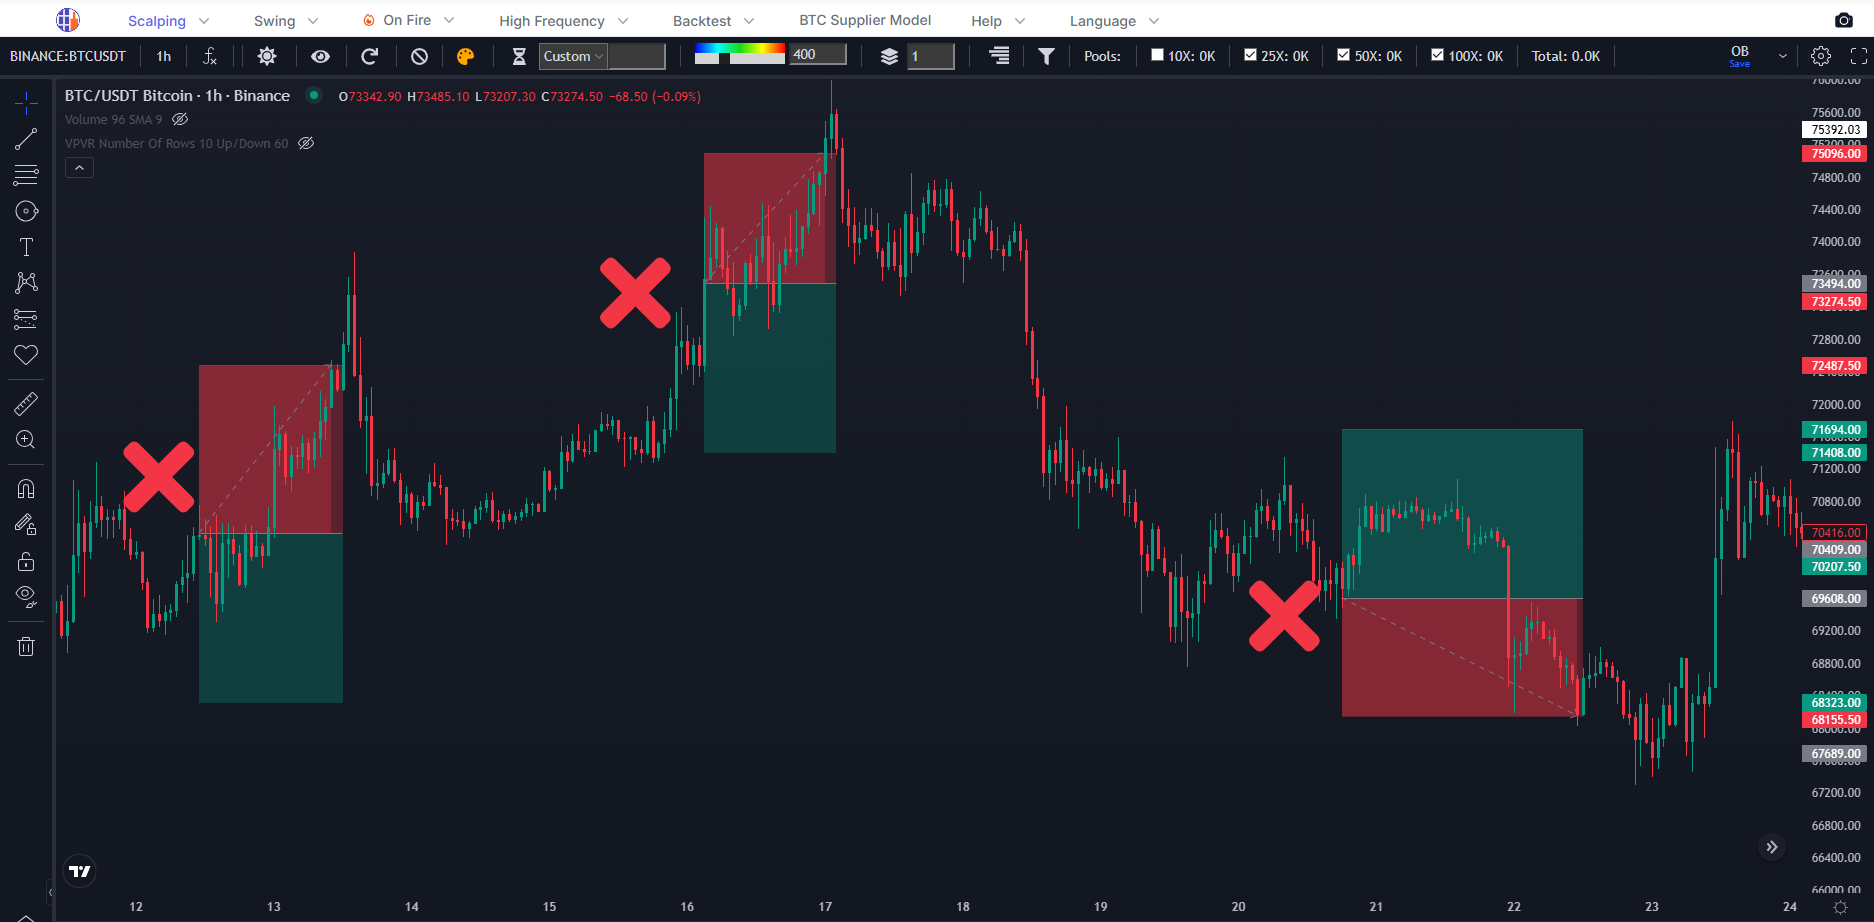
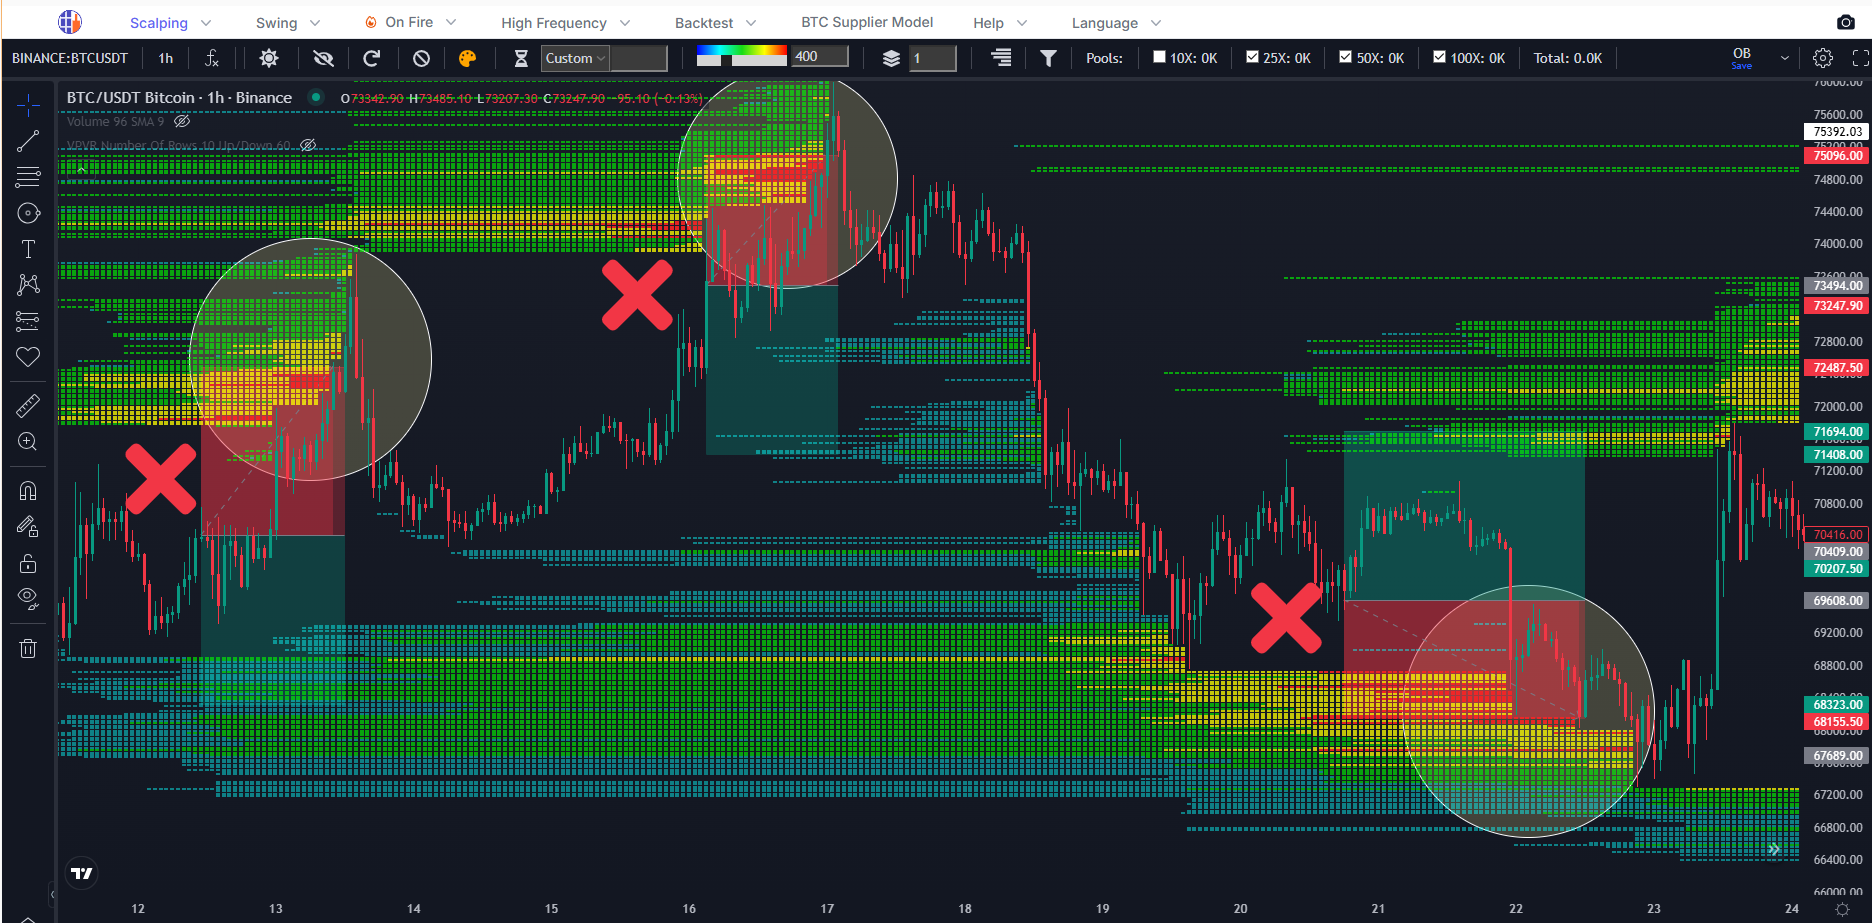
Two things you'll start doing differently:
Avoid placing your stop directly inside the areas where liquidation pressure is already stacked.
Identify where price may accelerate, reject, or absorb pressure as liquidations begin to trigger.
* More patterns covered in our tutorials and live Zooms.
Same engine. Same live data. Cut for how you actually operate.
Read the cycle, not the candle. Macro timing tools for patient capital operating on weekly and daily structure.
Trade the leverage, not the headlines. Full-resolution flow across every venue, timeframe, and asset class active desks actually watch.
AI trained on Trading Different's data
APINeed API access to program your own alerts, indicators or automated strategies? The Quant Pack is built for exactly that.
Explore the Quant Pack → →From intraday liquidity to macro cycles, institutional capital, and cross-asset context, all on the same engine.
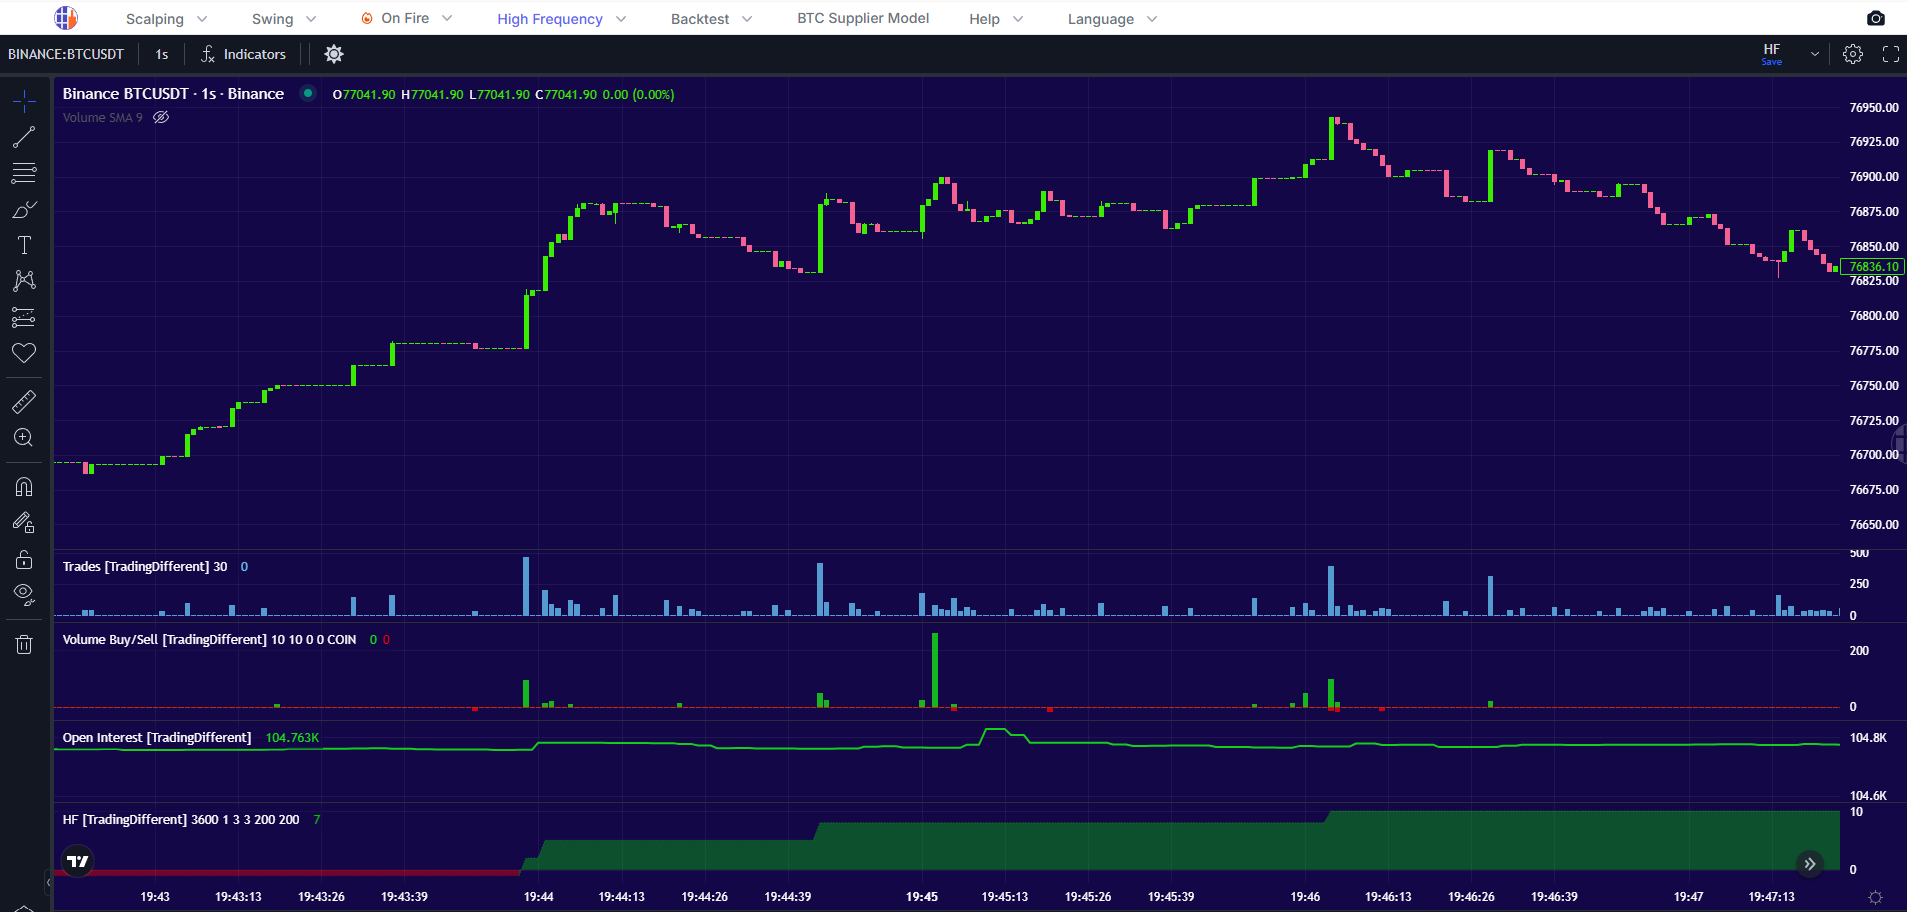
Tick-level data from high-frequency bots across 35 symbols. Surface the microsecond aggression hiding inside standard candles and trade with the same flow.
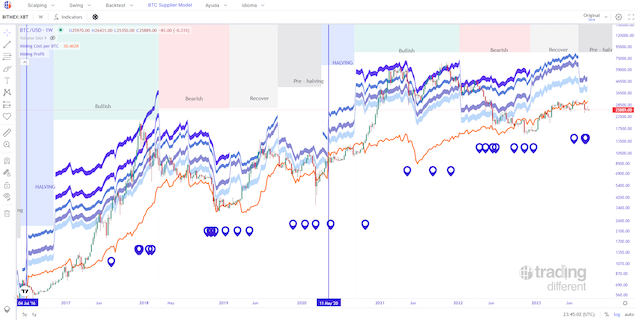
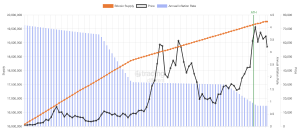
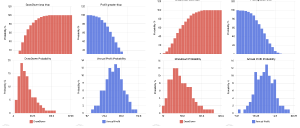
The full cost of producing 1 BTC mapped against miner profit-taking zones and key cycle events, on a long-horizon 1D / 1W view.
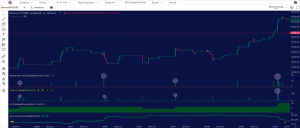
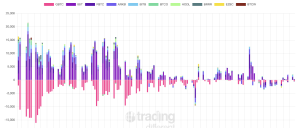
Every BTC bar since 2021 with the full indicator stack (OI, volume, liquidations and TrenDiff) across 5m to 4h.
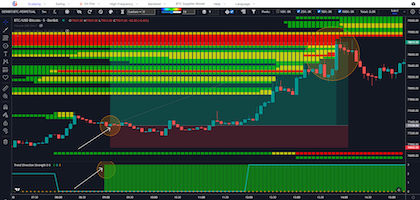
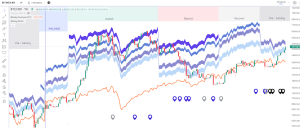
Indicator that marks the main trend of the market and helps us to operate in the same direction, seeking the Liquidation Pools as Take Profit targets. *Only available for Bitcoin.
Free Tap into our data, free of charge
Real posts. Public calls. Worldwide.
@tradingdiff Increíble análisis. El juego de liquidaciones siempre ofrece oportunidades emocionantes.
El trabajo de @IvanPazChain y todo su equipo de @tradingdiff es extraordinario!!
So cool! I like the gold liquidations, please keep adding further markets 💪
🛑LIQUIDEZ EN #BITCOIN Y OTRAS CRIPTOMONEDAS #HEATMAP @tradingdiff #ETH #XRP #TRX #LINK #DOGE HOY CON @IvanPazChain https://t.co/PB7EbRqcYO
Vamos a probarlo... una herramienta que puede complementar el resto de análisis que hacemos a diario.
Massive @tradingdiff liquidation cluster sits at 85K5, exactly the HL liquidation price 🚨 Everything aligns with this mf stop to be chased 🩸 But as posted previously, on a TA basis, this is still a SHORT. We've got a good entry at Saturday highs, so now we go risk free 🤝
🗿Gracias a @tradingdiff Tienen la mejor herramienta que hay ahora mismo para saber dónde está la liquidez.
I've been talking so much about @tradingdiff and how it helps me get ahead of the curve with the High-frequency trading bots indicator and liquidity pools. Also have a YouTube video for our Romanian community here: https://t.co/mtjV9S2jgN
Journalists in Spanish and English press have been writing about the Liquidation Heatmap for years. Before "AI in trading" was a headline.
The same liquidation clusters you see on the charts, delivered as a documented REST API. Poll it to build your own alerts, indicators or automated strategies — or just describe what you want to Claude Code, Cursor or Codex and let your agent wire it up. No coding on your side.
$ curl "…/v1/heatmap/latest?symbol=BTCUSDT&timeframe=5m"

"levels": [
  {
    "from_price": 108250.0,
    "volumes": {
      "L1": 12500.0,
      "L2":  8300.0,
      "L3":  4100.0,
      "L4":  1200.0
    }
  },
  // … 213 more price levels
]
Built for capital, not funnels. Pick your horizon.
Try the platform: no card, no time limit.
Macro timing for cycle investors.
Full-resolution flow for real traders.
| Free Pack | Holder Pack | Trader Pack | |
|---|---|---|---|
| Liquidation Heatmap | |||
| Symbols | On Fire altcoin* | Bitcoin + On Fire altcoin* | Bitcoin + 50+ altcoins |
| Timeframes | Not specified | 4h • 1D | 5m • 15m • 1h • 4h • 1D |
| Leverages | Not specified | 3× • 5× • 10× • 25× | 3× • 5× • 10× • 25× • 50× • 100× |
| Centralized exchanges | Not included | Binance | Binance • BitMEX • Bybit • Deribit |
| HyperLiquid DEX (BTC) | Included | Included | Included |
| Forex | XAU/USD (1D only) |
EUR/USD
XAU/USD
XAG/USD
GBP/USD
USD/JPY
|
|
| ETFs | SPY (1D only) |
SPY
QQQ
DIA
|
|
| Stocks |
MSFT
NVDA
AAPL
TSLA
MSTR
GOOGL
AMZN
META
AMD
|
||
| Tools & Data | |||
| Liquidation Simple Map | Included | Included | |
| Liquidation Profile | Included | Included | |
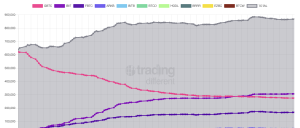
| BTC Supplier Model | Included | Included | |
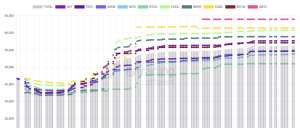
| Crypto Emission Rate | Included | Included | Included |
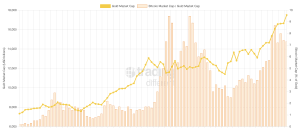
| Bitcoin vs Gold | Included | Included | Included |
| ETF & Companies Holders | Included | Included | Included |
| CME Futures | Included | Included | Included |
| On Fire Heatmap & HF | Included | Included | Included |
| Risk Calculator | Included | Included | Included |
| Discord | Included | Included | Included |
| Live Zooms | Included | Included | |
| High Frequency Chart | Included | ||
| Historical Chart | Included | ||
| TrenDiff Indicator | Included | ||
| Buy/Sell Volume, OI, Liq. | Included | ||
* On Fire: we pick one trending altcoin (based on volume, momentum, and trader interest) and unlock it across every plan, Free included. The pick rotates as the market moves, usually every 1–4 weeks.
Everything about the Liquidation Heatmap: how it works, the markets and exchanges it covers, and how the plans compare.
A liquidation heatmap is a visual tool that shows the price zones where leveraged traders would be forced to close their positions ("liquidated") if the price reaches those levels. On Trading Different, the Liquidation Heatmap estimates these areas of high liquidation risk, helping you spot market pressure zones and possible price targets. It doesn't show actual orders or how much will be liquidated, but highlights where the price could move explosively due to liquidations.
Traders use liquidation heatmaps to identify where there is a high concentration of leveraged positions at risk of being liquidated. These zones often act as "price magnets," where sudden moves can occur due to forced liquidations. By seeing these zones, traders can anticipate potential areas of sharp price moves, set better stop losses, and spot where institutional traders or bots might target next. It's mainly for context and risk management, not for trading signals.
No, the liquidation heatmap does not predict price direction or guarantee where price will go. It shows zones where there is a concentration of possible liquidations, meaning areas of higher risk for sharp price moves if those zones are reached.
No, it's not the same. An order book heatmap shows where limit buy/sell orders are placed on the exchange, basically where people want to buy or sell. A liquidation heatmap, like the one on Trading Different, highlights zones where leveraged positions will be forced to close if the price hits those levels, based on estimated risk, not placed orders.
Yes, you can! Trading Different's liquidation heatmaps support Crypto, Forex, Stocks, and even Gold ETFs. Just select your preferred market and pair directly in the tool.
The platform aggregates data from multiple liquidity providers and institutional sources, like Binance, BitMEX, Bybit, Deribit and Hyperliquid. For forex, gold, ETFs and stocks, the algorithm combines information from several major platforms to generate average estimates for each asset.
Yes! Most Trading Different tools include guides, documentation, and video tutorials directly inside each tool's section. You'll also find explanations on the dashboard and, if you need help from the community or want more in-depth material, you can join the Discord community via the "Academy" section on the left panel in the dashboard.
The main difference: the Holder Pack focuses on long-term Bitcoin analysis tools, while the Trader Pack gives full access to all trading-oriented and real-time tools.
Designed for Bitcoin investors and holders (not for scalping or short-term trading). Includes tools like:
Best for people who invest based on macro trends or want to understand long-term market behavior.
The most complete plan, ideal for active traders (swing or scalping). Includes all tools, including those in the Holder Pack. All markets (Bitcoin, altcoins, Forex, ETFs and Stocks), all timeframes (5m, 15m, 1h, 4h, 1D), and higher leverage from 3x up to 100x (or more on Forex and Stocks).
We accept a variety of secure payment methods: bitcoin, stablecoins and credit cards. There are no automatic subscriptions on Trading Different. Nothing renews by itself. If you want to continue using a plan, you simply purchase a new one manually.
See where liquidation risk is stacked before price gets there. Use the same map to stop donating your stops to the market.
78 symbols across 4 markets.


No symbols match your search


No symbols match your search
No symbols match your search


No symbols match your search